
100-METER SPRINT ASSESSMENT
Introduction
The 100-meter sprint in physical education classes is widely used to evaluate students’ speed. Traditionally, assessment relies solely on total sprint time. While simple, this method is outdated and has significant limitations. It is time to upgrade the way sprint performance is assessed.
Through this content, we explore ways to improve sprint assessment beyond the traditional method. To apply this approach, it is necessary to record video footage in the manner presented here (LINK).
Content Overview
1. Current 100-Meter Assessment in PE Classes and Its Limitations
2. Expanding the 100-Meter Sprint Assessment
3. Three Typical Performance Curves
4. Conclusion
1. Current 100-Meter Assessment in PE Classes and Its Limitations
The following picture shows a typical assessment and normative times for students aiming to join sports universities in Guangdong Province, China.
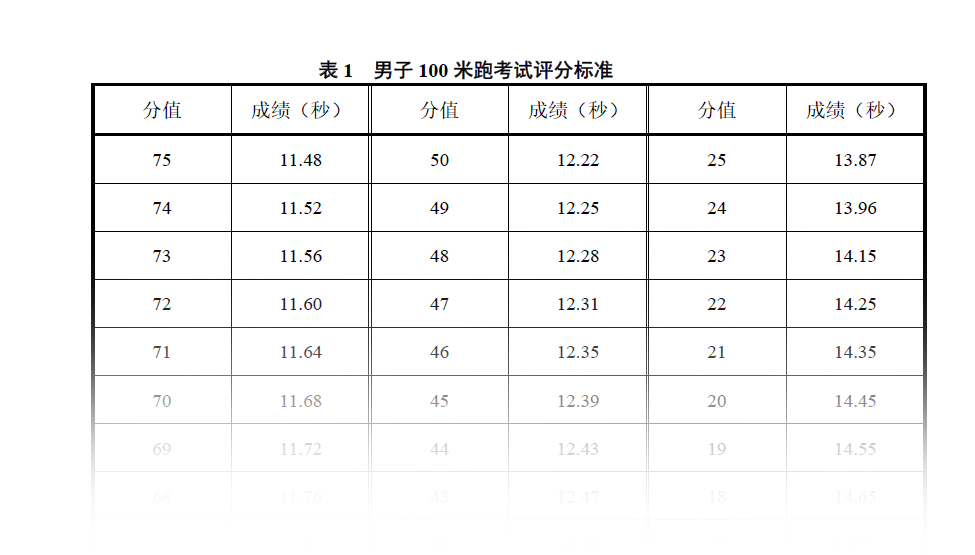
Most schools use a similar approach: only total sprint time is recorded, and scoring varies across grade levels.
Limitations of This Method
• Incomplete Information: Total time does not show how a student achieved the result.
• Hidden Differences: Students with the same time may have very different sprint patterns, for example:
• Strong start but slowing down toward the finish
• Slower start but faster acceleration later in the sprint
• Missed Performance Insights: Key factors such as reaction time, acceleration, stride length and frequency, running technique, and speed consistency are ignored.
Consequences for Training
• Teachers and coaches cannot pinpoint areas for improvement.
• Training is less targeted and feedback is limited.
• Tracking progress over time is less meaningful.
Relying only on total sprint time underrepresents a student’s true sprint ability. A more detailed assessment is needed to understand performance better and provide training tailored to each student’s needs.
2. Expanding the 100-Meter Sprint Assessment
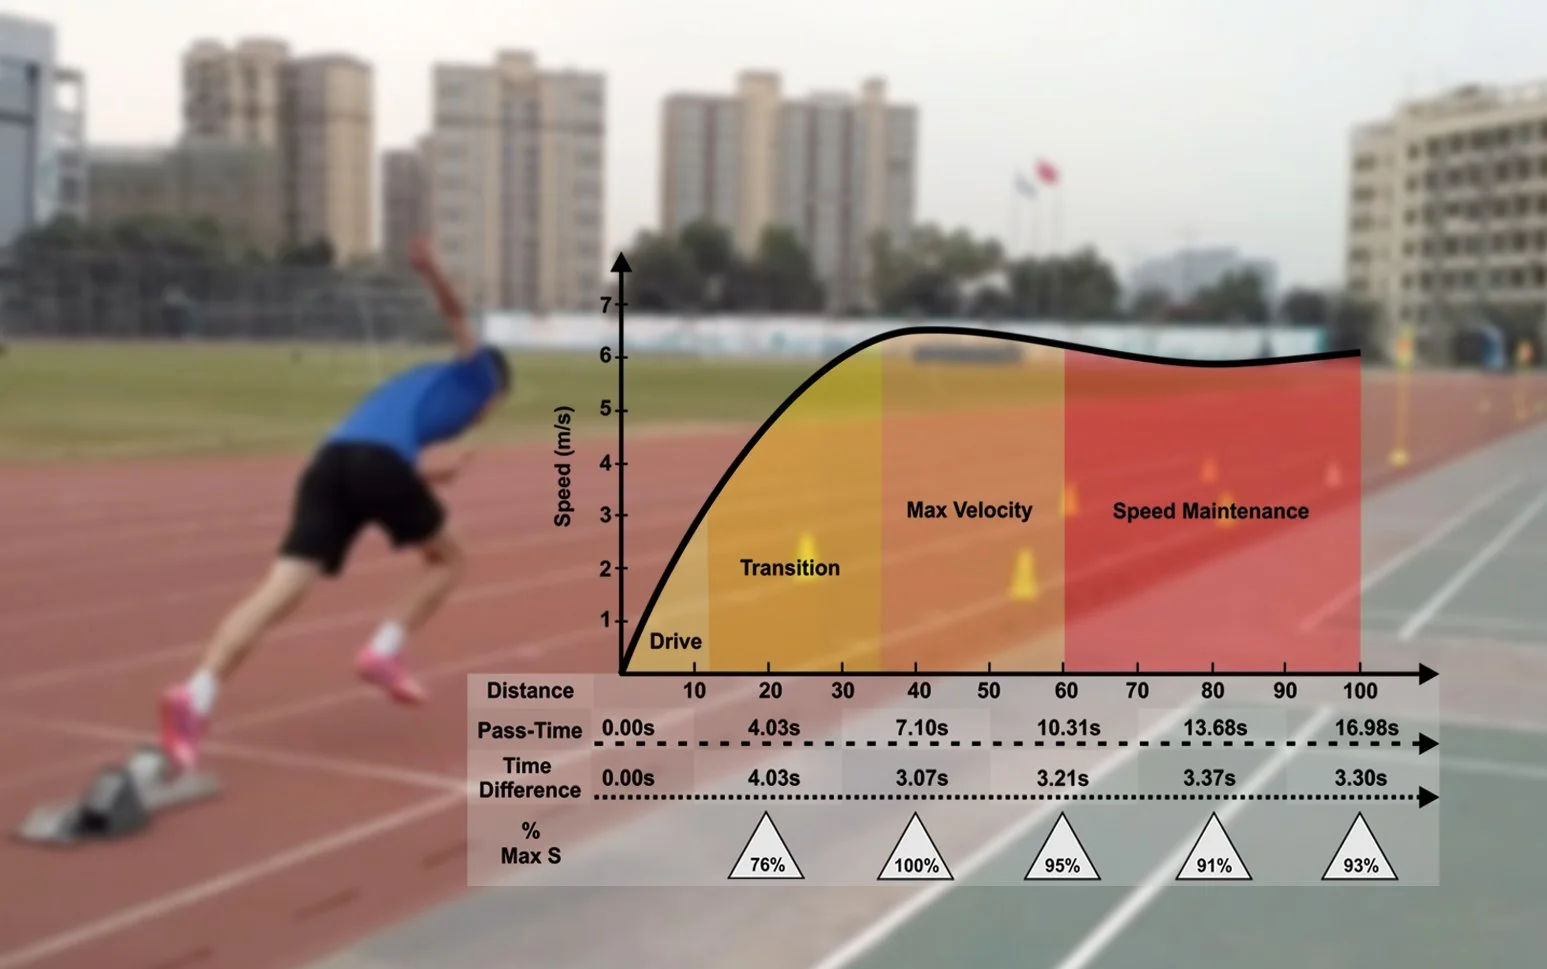
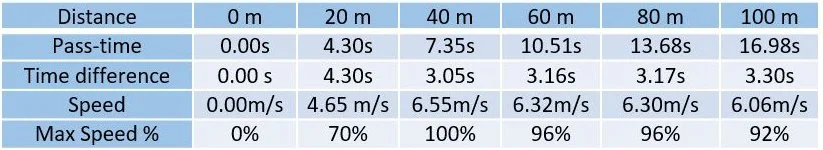
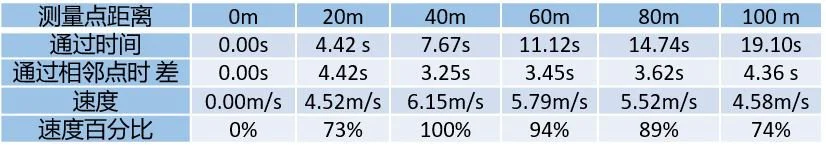
The following example shows how detailed recording improves understanding of sprint performance. Two primary students were timed every 20 meters during a 100-meter sprint. The Grade 3 student completed the run in 16.98 seconds, and the Grade 4 student in 19.10 seconds.
Student 01

Student 02
The data and graphs illustrate how each runner’s speed changes along the track, revealing differences in acceleration, rhythm, and endurance that a single final time cannot show.
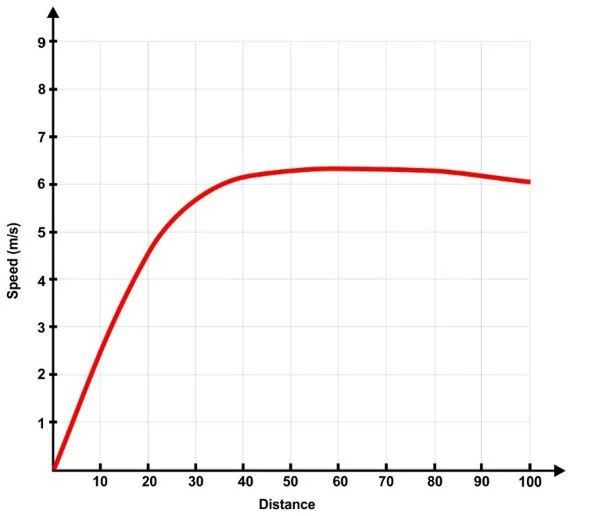
3. Three Typical Performance Curves
Although there can be many variations, sprint results often fall into three basic curve patterns:
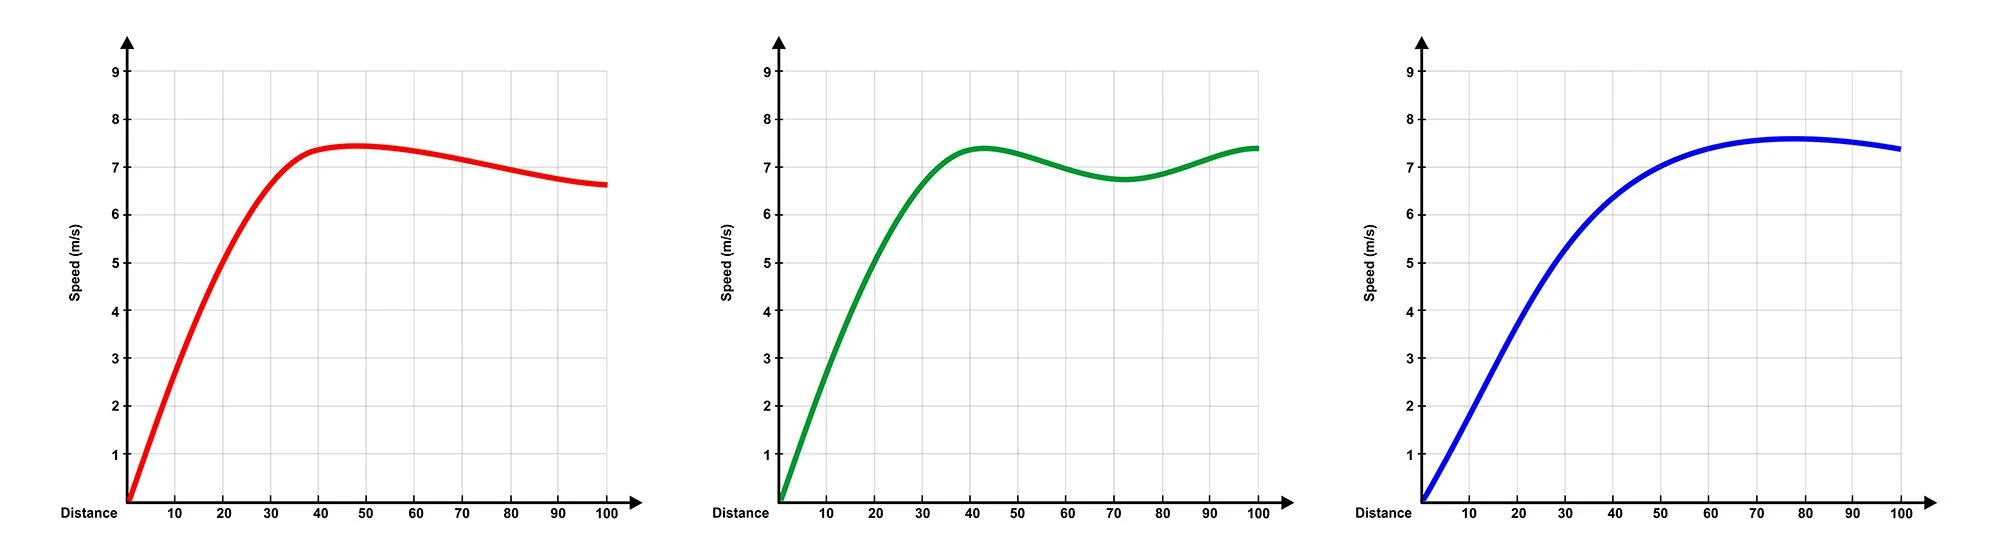
Red Curve – Fast Start, Early Decline
•Strong acceleration at the beginning but difficulty maintaining speed.
•→ Focus on endurance and sustaining form.
Green Curve – Uneven Pace
•Fluctuating speed with a slowdown in the middle section.
•→ Focus on rhythm control and consistent effort.
Blue Curve – Smooth, Late Peak
•Gradual increase in speed with a strong finish.
•→ Focus on explosive starts and faster acceleration early on.
4. Conclusion
Segmenting the 100-meter sprint provides insights into running dynamics that traditional assessments typically overlook. This approach enables teachers to design targeted drills, deliver individualized feedback, and help students better understand their own movement patterns. It transforms sprint assessment into a more meaningful and educational process.
In addition, this method supports the development of structured analytical frameworks and practical coaching resources. Further frameworks and applied materials can be explored in the following links (LINK0), (LINK1), and (LINK2).