
Observing walking with the naked eye or through conventional video can provide useful insights into movement patterns. However, reconstructing movement through XYZT data (three-dimensional coordinates over time) takes this observation further, making movement measurable and allowing it to be examined in greater detail.
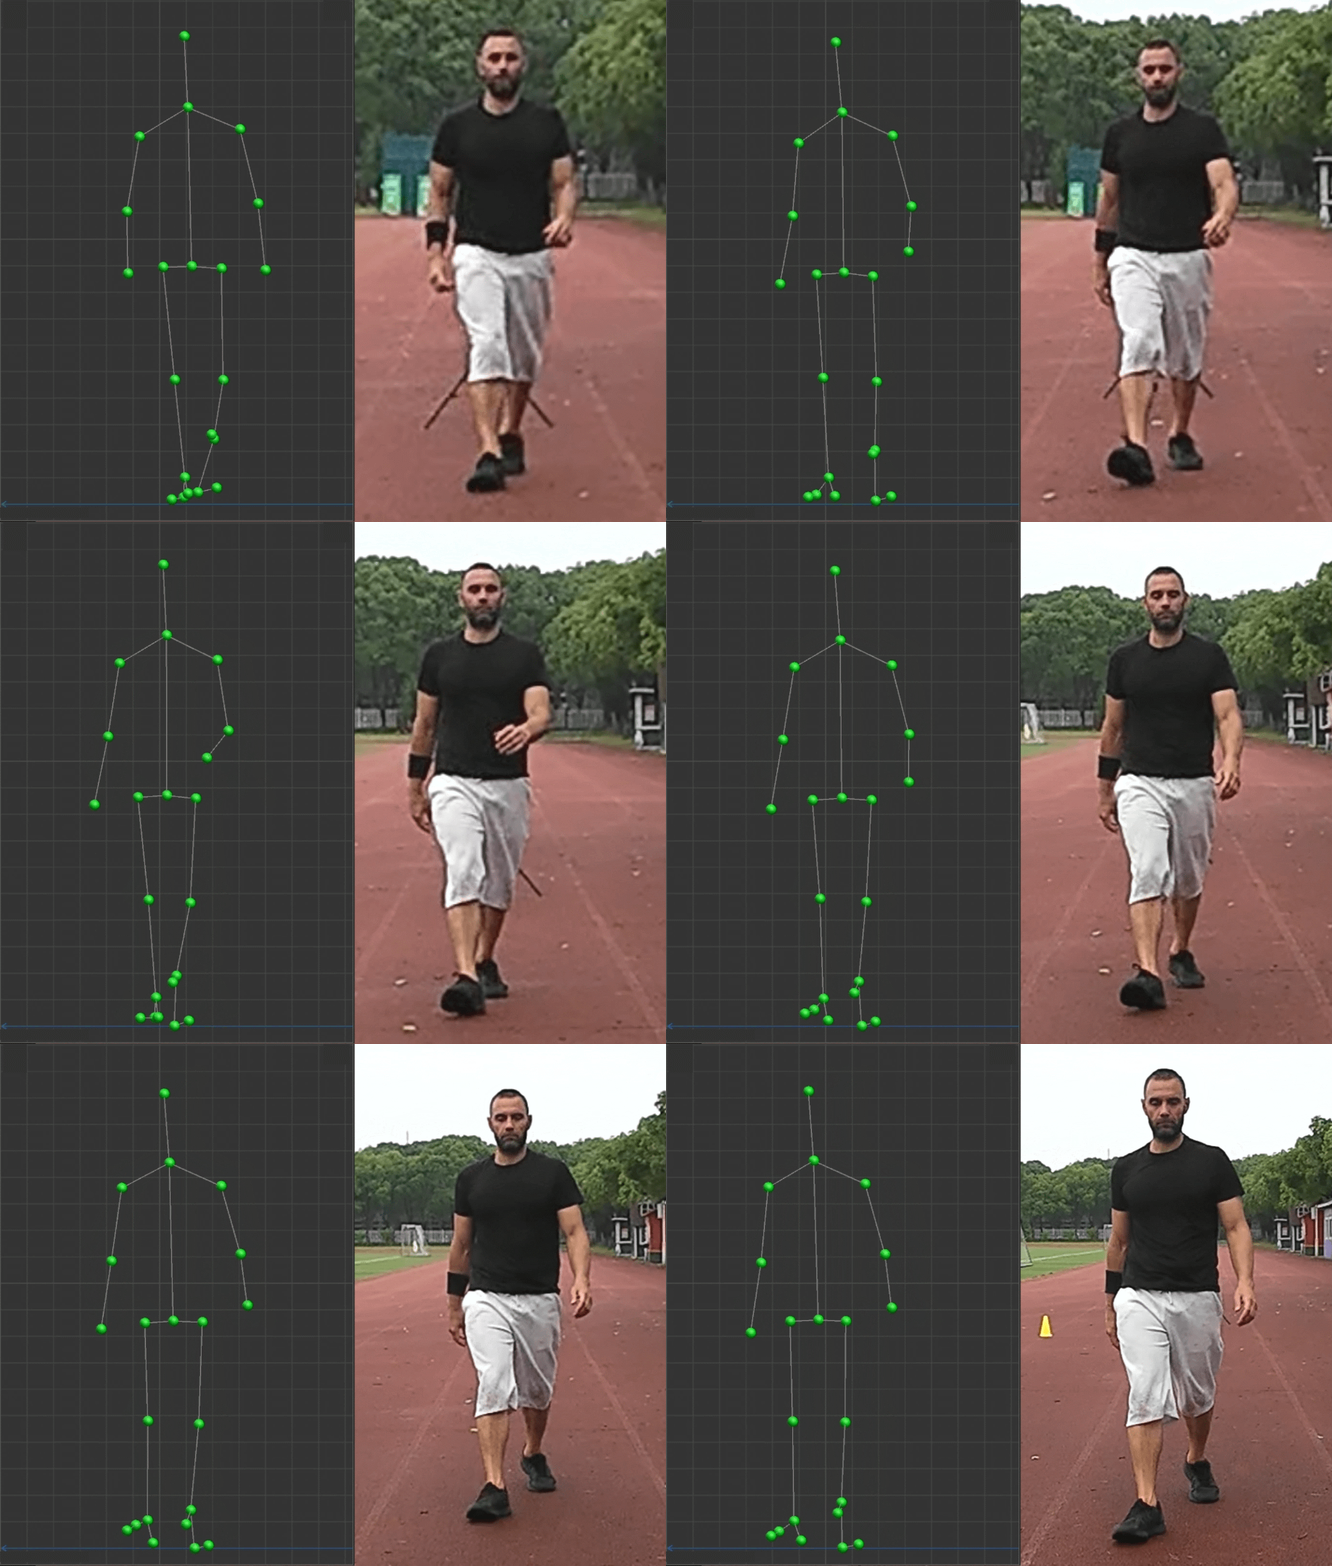
Visual 01. Front view – 2D walking video and 3D reconstruction
The following example demonstrates how a recorded walking sequence can be transformed into structured numerical data and used to extract biomechanical parameters. These measurements can then be explored, compared and interpreted in different ways, depending on the purpose and individual needs.
The same walking sequence was previously explored in an article focusing on the visual representation of the body's centre-of-mass trajectory during the transition between walking and running. [Read the related article]
The visuals below present the same walking sequence from different perspectives. These complementary viewpoints demonstrate how 3D reconstruction extends movement analysis beyond conventional 2D video observation, providing additional insights into spatial relationships and body-segment positioning.
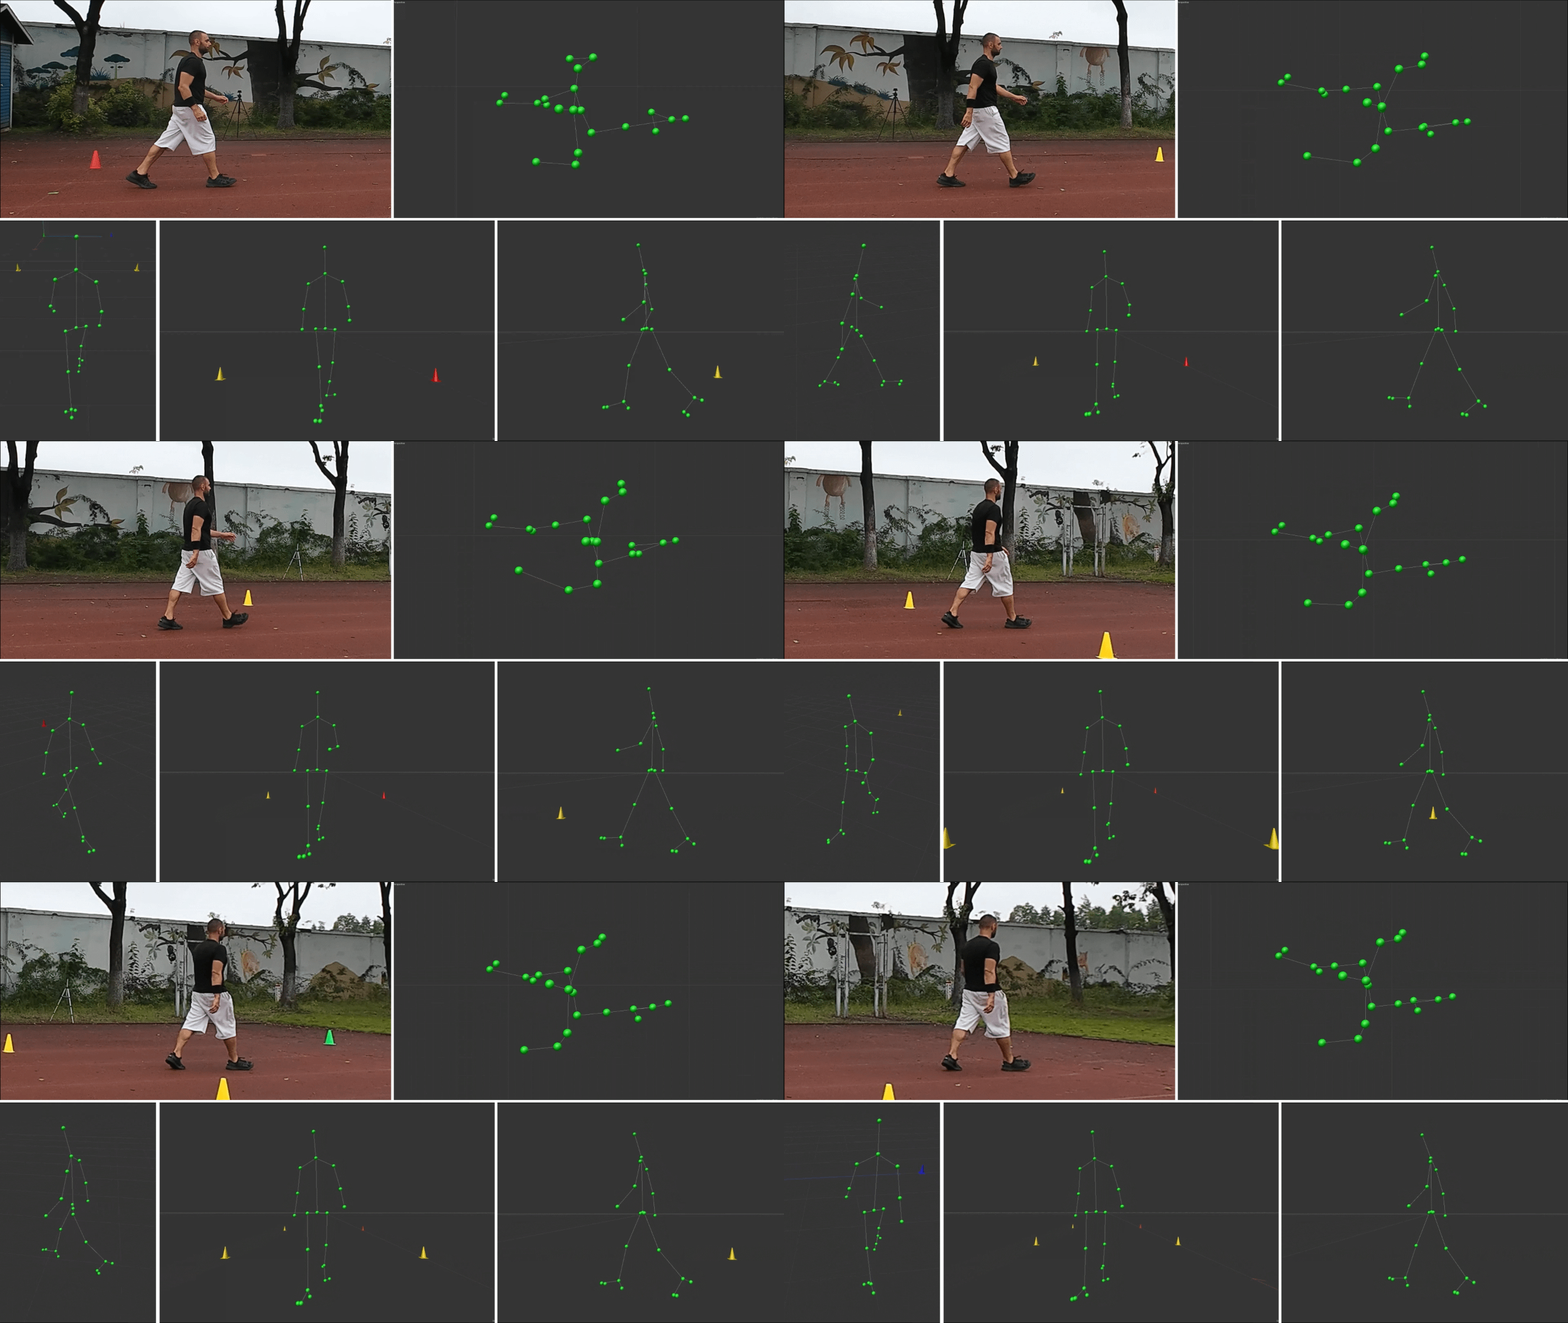
Visual 02. Perspective views – 2D walking side video and 3D reconstruction
The comparison illustrates how conventional walking video can become a source of structured 3D movement data, providing additional information about gait characteristics that cannot be quantified through visual observation alone.
FROM 3D RECONSTRUCTION TO NUMERICAL DATA
The anatomical landmarks extracted from the walking sequence are stored as XYZ coordinates for each frame, together with their corresponding timestamps. This transforms the reconstructed movement into structured numerical data that can be further processed and analysed. For those interested in the technical side, the exported CSV file is available below for download. It provides an example of how 3D movement is represented numerically and organised for further analysis.
[Download the CSV coordinate data]
The downloaded file can also be used as an input for online AI tools. By uploading the dataset and providing appropriate instructions, users can explore the information, request specific calculations, investigate movement patterns and identify possible directions for further analysis. This offers an accessible starting point for understanding the data and exploring its potential applications according to individual interests and requirements. AI-generated findings should, however, be checked against appropriate biomechanical methods.
EXTRACTED GAIT PARAMETERS
The following report presents selected parameters derived from the reconstructed walking sequence, organised into temporal, spatial, speed, centre-of-mass and joint-kinematic categories.
The original dataset contains 701 frames recorded at 120 FPS, representing approximately 5.83 seconds of movement, with around five steps performed by each leg.
Note: Numerical results are preliminary estimates from a single walking trial and require further methodological validation.
Temporal parameters
Parameter Average value
Cadence 105.02 steps/min
Stride Duration 1.142 s
Step Duration – Left 0.585 s
Step Duration – Right 0.560 s
Stance Phase – Left 65.26%
Stance Phase – Right 66.61%
Swing Phase – Left 34.74%
Swing Phase – Right 33.39%
Double Support Time 0.360 s
Interpretation: The small differences in step duration and phase distribution provide useful reference points for examining left–right gait symmetry.
2. Spatial parameters
Parameter Average value
Step Length – Left 83.88 cm
Step Length – Right 74.85 cm
Stride Length 158.16 cm
Interpretation: The difference in left and right step lengths provides a useful reference point for examining stride symmetry and differences in how each leg contributes to forward movement.
3. Speed and centre of mass
Parameter Average / peak value
Average Walking Speed 136.42 cm/s
COM Vertical Displacement 6.32 cm
COM Lateral Displacement 13.26 cm
COM Forward Velocity Peak 164.76 cm/s
Interpretation: These measurements provide reference points for further examining walking speed, vertical and lateral body movement, and how effectively forward momentum is maintained throughout the gait cycle.
4. Joint kinematics – Peak angles
Joint Left Right
Hip Flexion 27.82° 27.66°
Knee Flexion 66.57° 62.92°
Interpretation: The small differences in peak hip and knee flexion provide reference points for further examining left–right joint coordination and differences in lower-limb movement during walking.
5. Asymmetry index
Parameter Result
Step Length Asymmetry 11.37%
Step Time Asymmetry 4.44%
Interpretation: The difference between step length and step time asymmetry provides a basis for examining left–right gait consistency, with a more noticeable difference in step length than in timing.
IMPORTANT METHODOLOGICAL CONSIDERATIONS
Averaging: These figures are carried forward from the previous analysis. They have not been independently recalculated as arithmetic averages across all five cycles of each leg. They should therefore be treated as provisional sequence-level estimates.
Gait events: Heel-strike and toe-off detection must be verified before accepting temporal and spatial measurements.
COM: Values are model-based estimates, not direct measurements.
Joint angles: Hip and knee angles require consistent anatomical definitions; ankle dorsiflexion remains unvalidated.
Calibration: Spatial measurements assume 1 C4D unit = 1 cm.
Validation: Results should be compared with a reference motion-capture system before being presented as validated biomechanical measurements.
Conclusion: Until recently, detailed 3D movement analysis was largely confined to specialised laboratories, requiring expensive equipment and trained professionals. Markerless, video-based technology is changing that, making this type of analysis more affordable and accessible to a much wider audience.