
MAKING BALL–FOOT CONTACT VISIBLE IN KICKING PERFORMANCE
Introduction
Many factors influence kicking performance, but the moment of ball–foot contact plays a key role in determining the direction, power, and accuracy of the kick. This work builds on earlier research, “Analyzing Kicking Foot Trajectories in Youth Soccer Players,” which examined the movement of the kicking leg and extracted trajectory data. The present work shifts the focus to the contact phase itself—the interaction between the foot and the ball.
The content is presented mainly through visual representations, designed to support assessment and learning for young players. Using 2D and 3D visualizations, this approach connects observation with feedback, making technical information clearer. Children learn most effectively when they can see what is happening, so visualizing ball–foot contact helps turn an abstract biomechanical concept into something students can observe, discuss, reflect on, and improve—making it engaging and meaningful.
Content Overview
1. Contact Surfaces
1.1 Ball surface and its spherical representation on a flat plane
1.2 Division of foot contact surfaces
2. Student Assessment of Ball–Foot Contact
2.1 Observing ball–foot contact using a measured grid
2.2 3D simulation of ball–foot contact
2.3 Visual representation of foot surface contact
2.4 Relationship between ball contact location and foot attack direction.
1.Contact Surfaces
Before we evaluate the action, it is essential to introduce the basic visual concepts of the ball and the foot, and how we will present their surfaces. Understanding these visual representations is necessary at the beginning, as they form the foundation for the rest of the assessment.
The following visuals serve as the base for later assessment steps. They help transform a complex movement into clear visual information, so educators and students can better understand, discuss, and improve their kicking technique.
1.1 Ball Surface and Spherical Representation
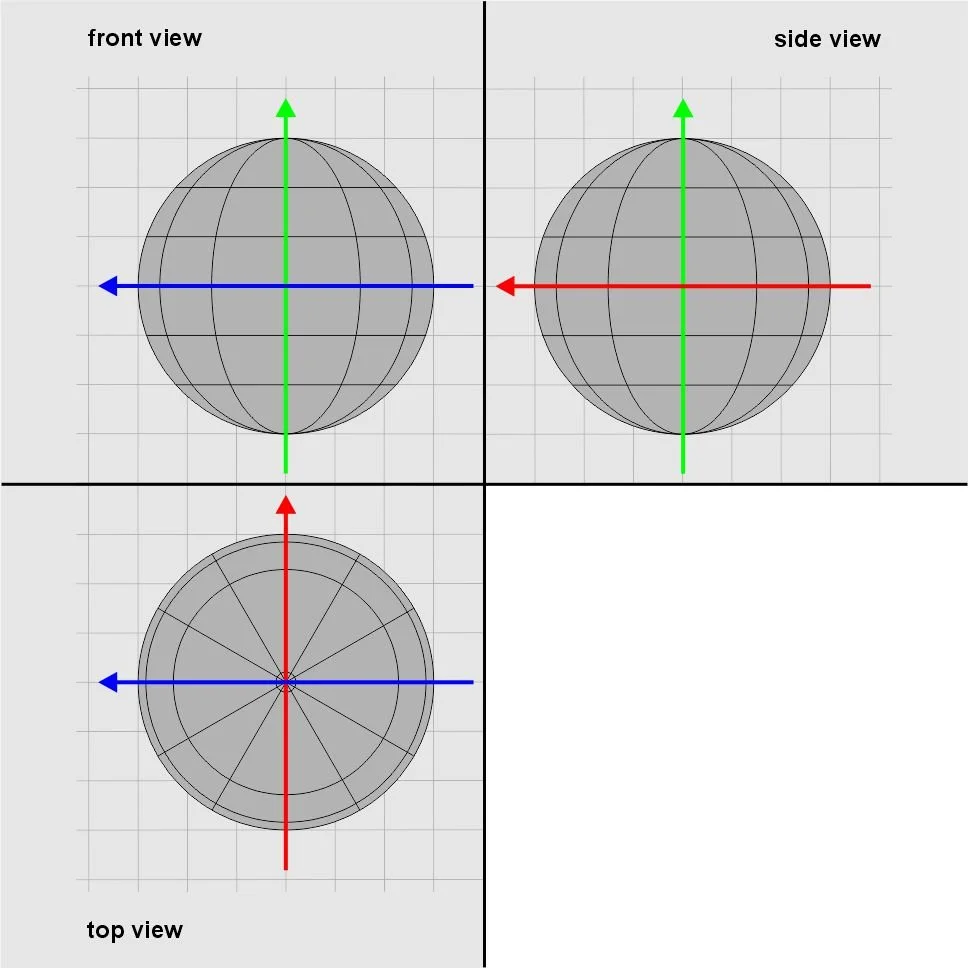
As a first step, we will introduce how to describe the surface of the ball using measurable values. The ball is a sphere, and we can divide its surface into latitude (horizontal) lines and longitude (vertical) lines. Each line is assigned a numerical value, so every point on the ball can be identified clearly.
Visual 01
The animation above shows students how the spherical surface is transformed into a flat surface. It also illustrates the center of the ball with the X, Y, Z axes, helping students understand how the values are determined and represented. These values will be used later in our evaluation.
This system helps us understand exactly where the foot contacts the ball. By knowing the location of contact, students and teachers can better explain how the foot’s position on the ball affects the kick.
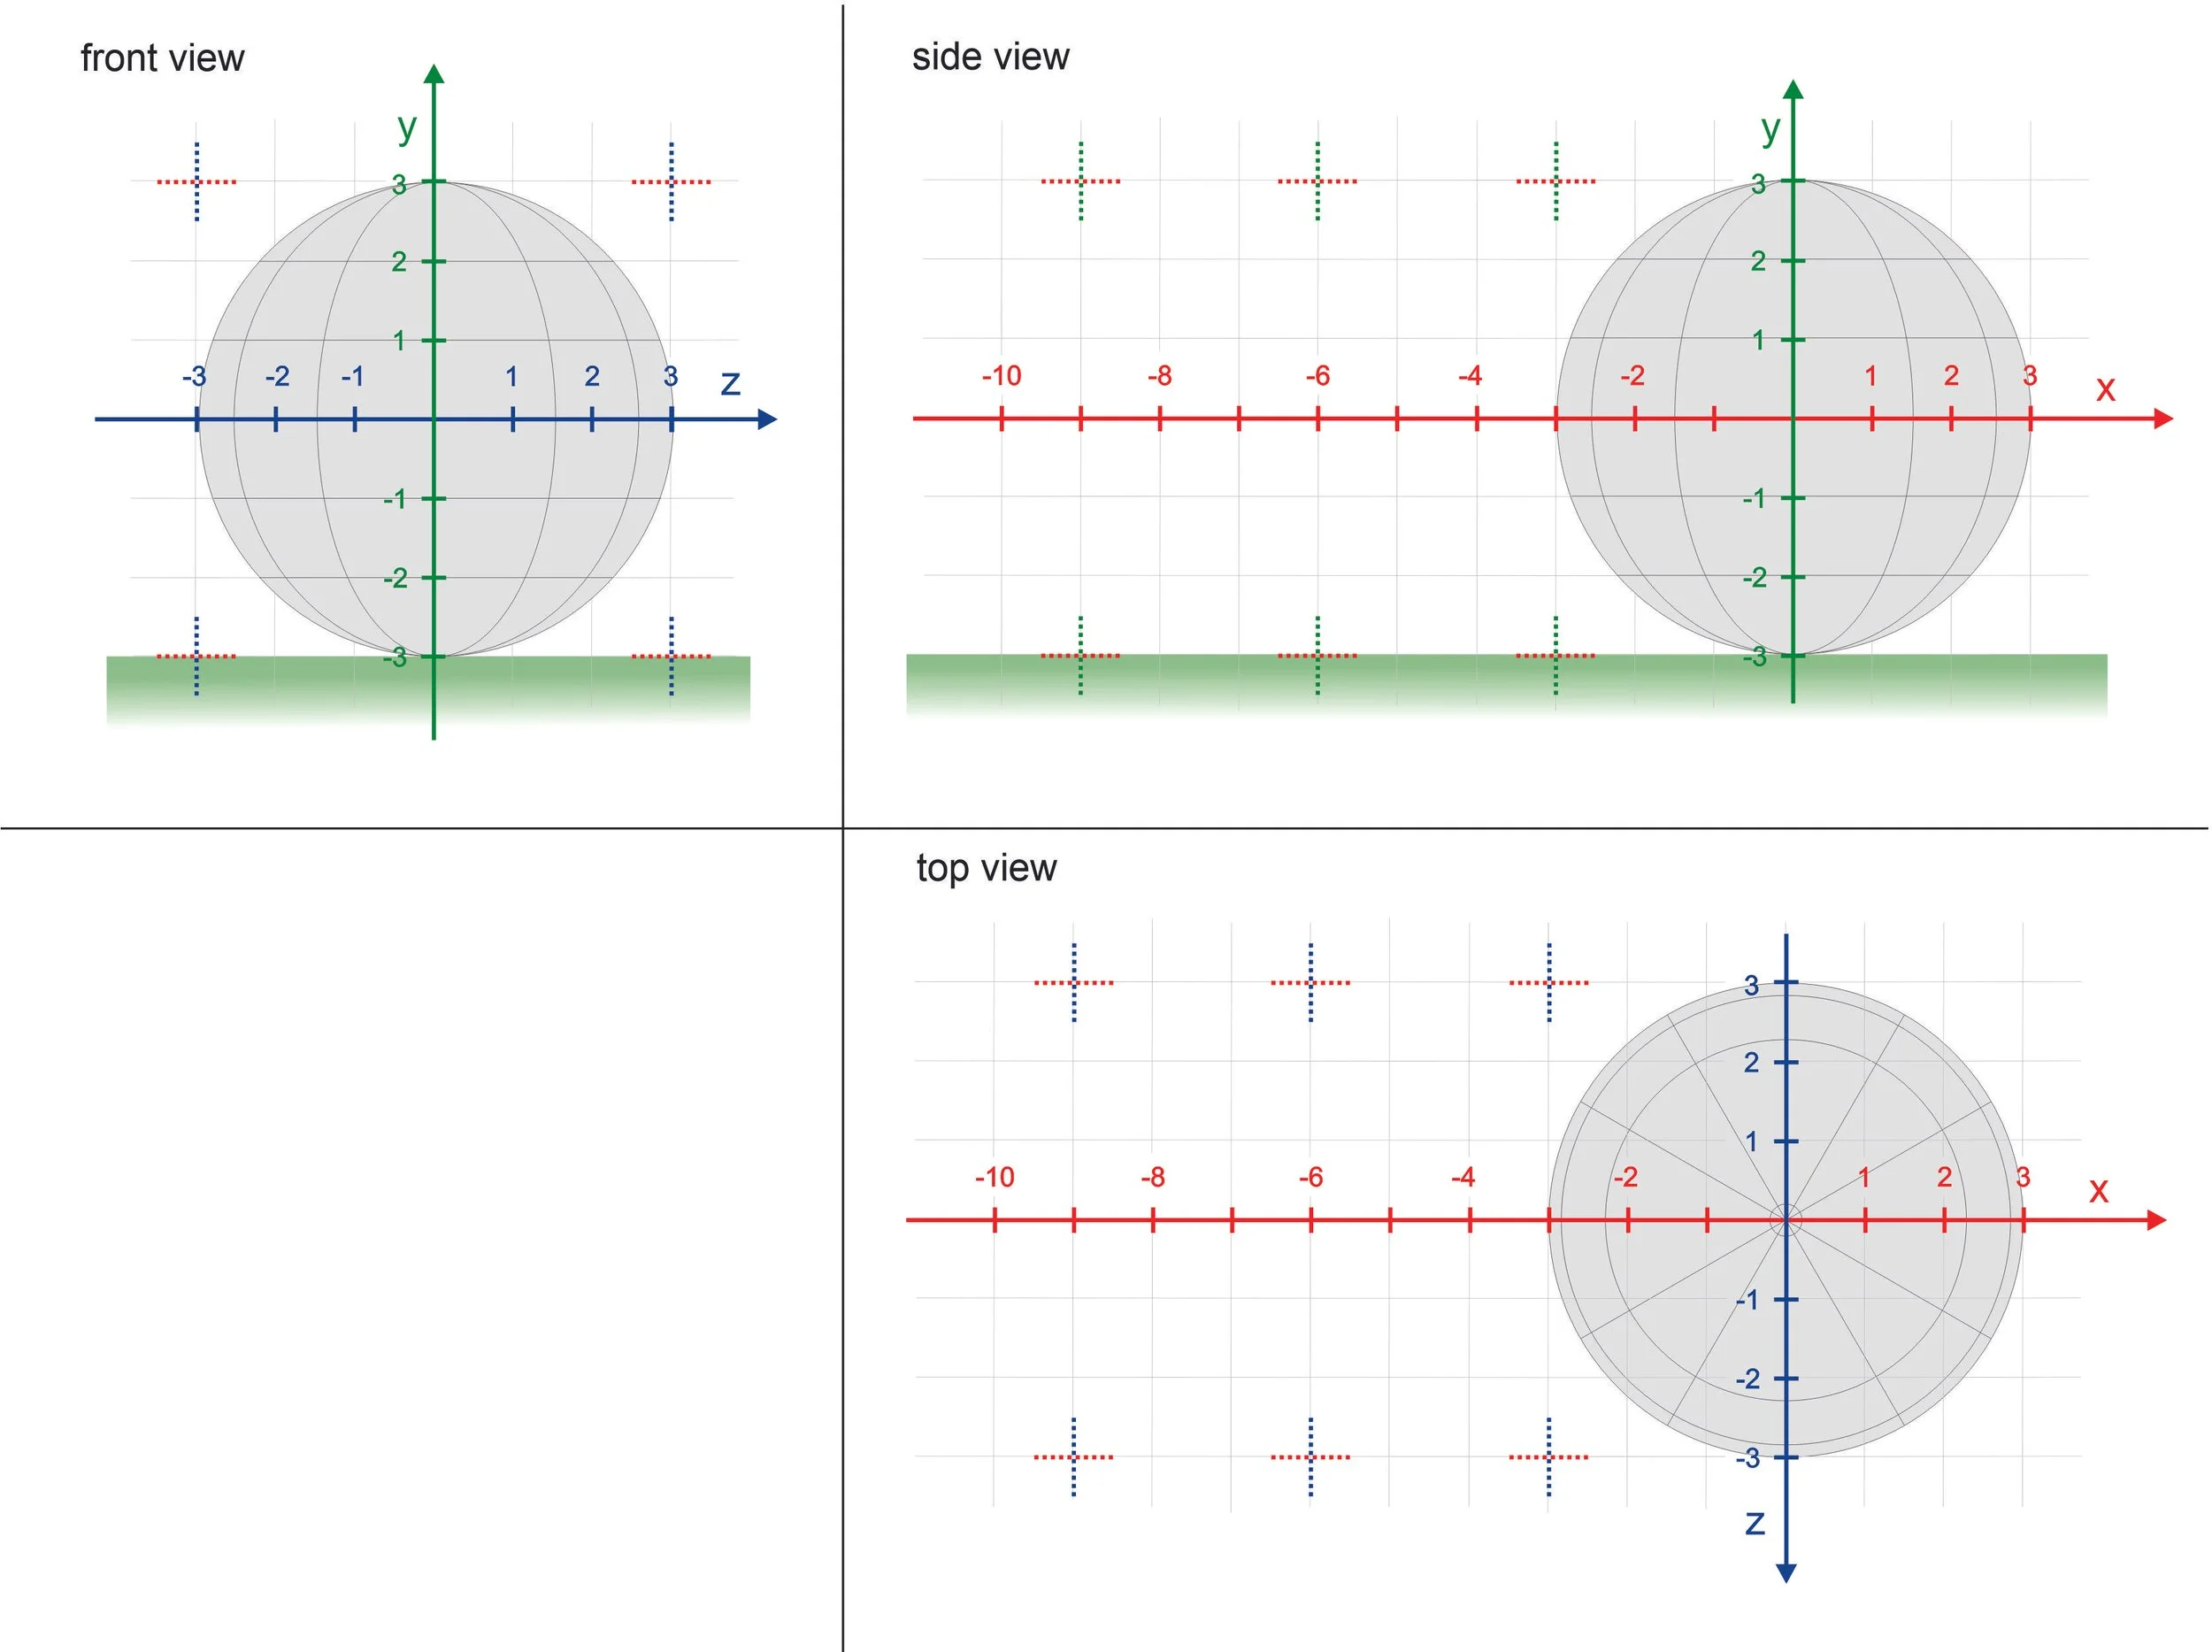
Visual 02
To make the concept easier to understand, the spherical surface can also be represented on a flat surface, where the values become more visible and easier to read.
Visual 03
Using this 3D simulation, we measured the true spatial path of the foot—capturing its upward, forward, and lateral movement in one integrated model. This comprehensive approach allowed us to analyze the motion more accurately than any single camera angle could achieve.
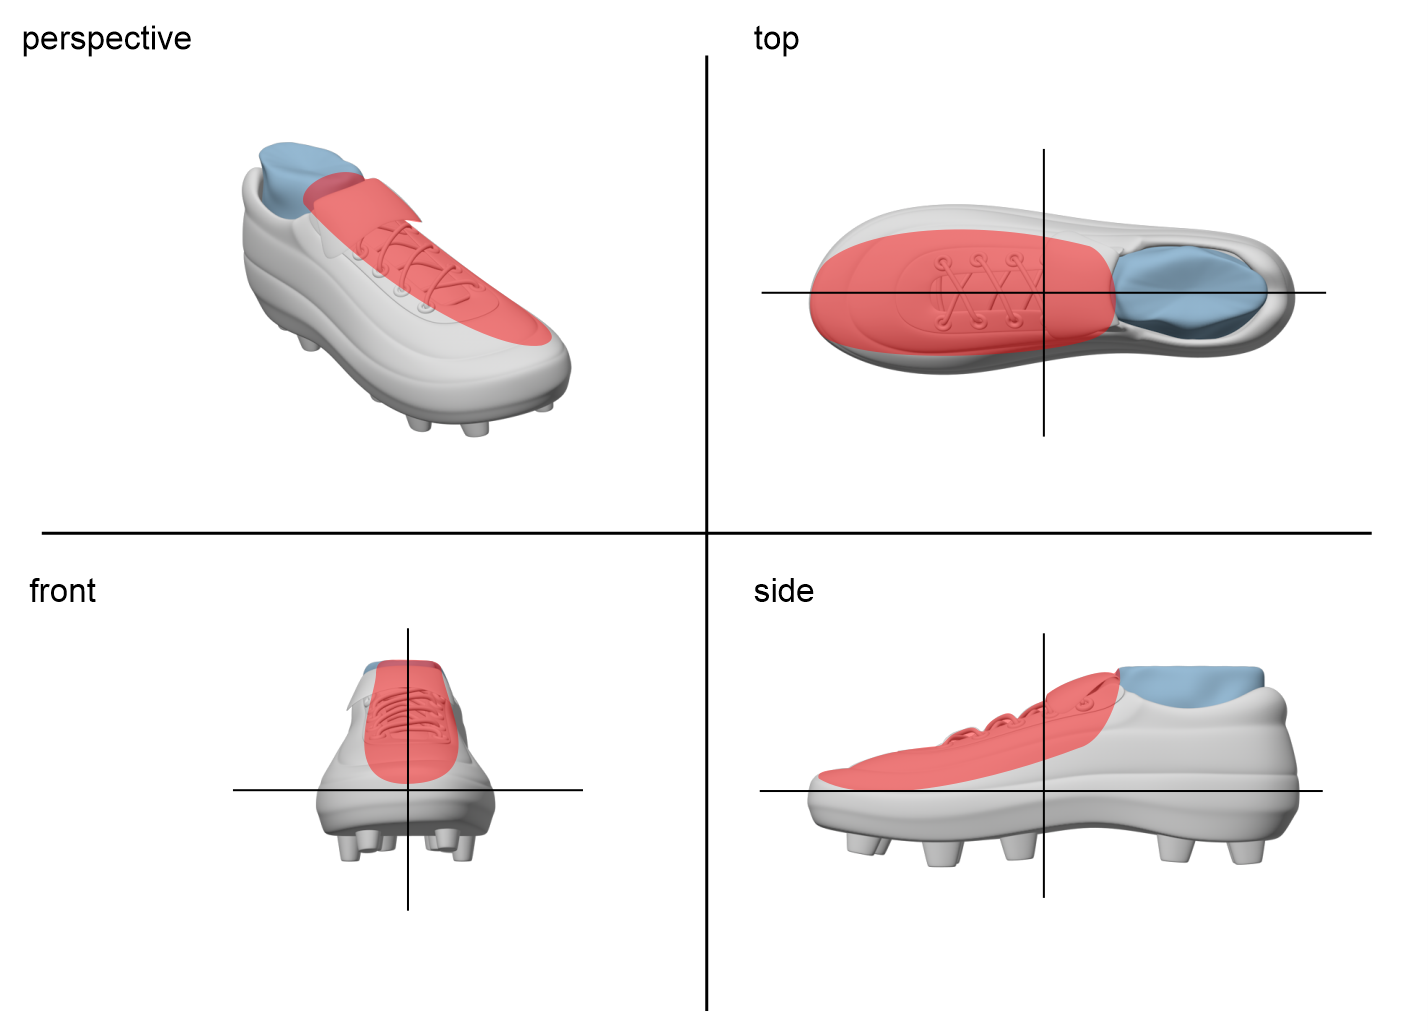
1.2 Division of foot contact surfaces
The next step is to divide the kicking foot into different contact zones. This helps identify which part of the foot touches the ball during the kick. Depending on the kick, different parts of the foot can be used, such as: Toe, Instep (laces), Inside, and Outside. Each zone affects the direction and power of the ball differently.
This division allows students and teachers to: identify the exact contact area, understand the relationship between foot placement and ball movement, and provide specific feedback for improvement. We used a 3D model of the foot, shown in different planes and perspectives.
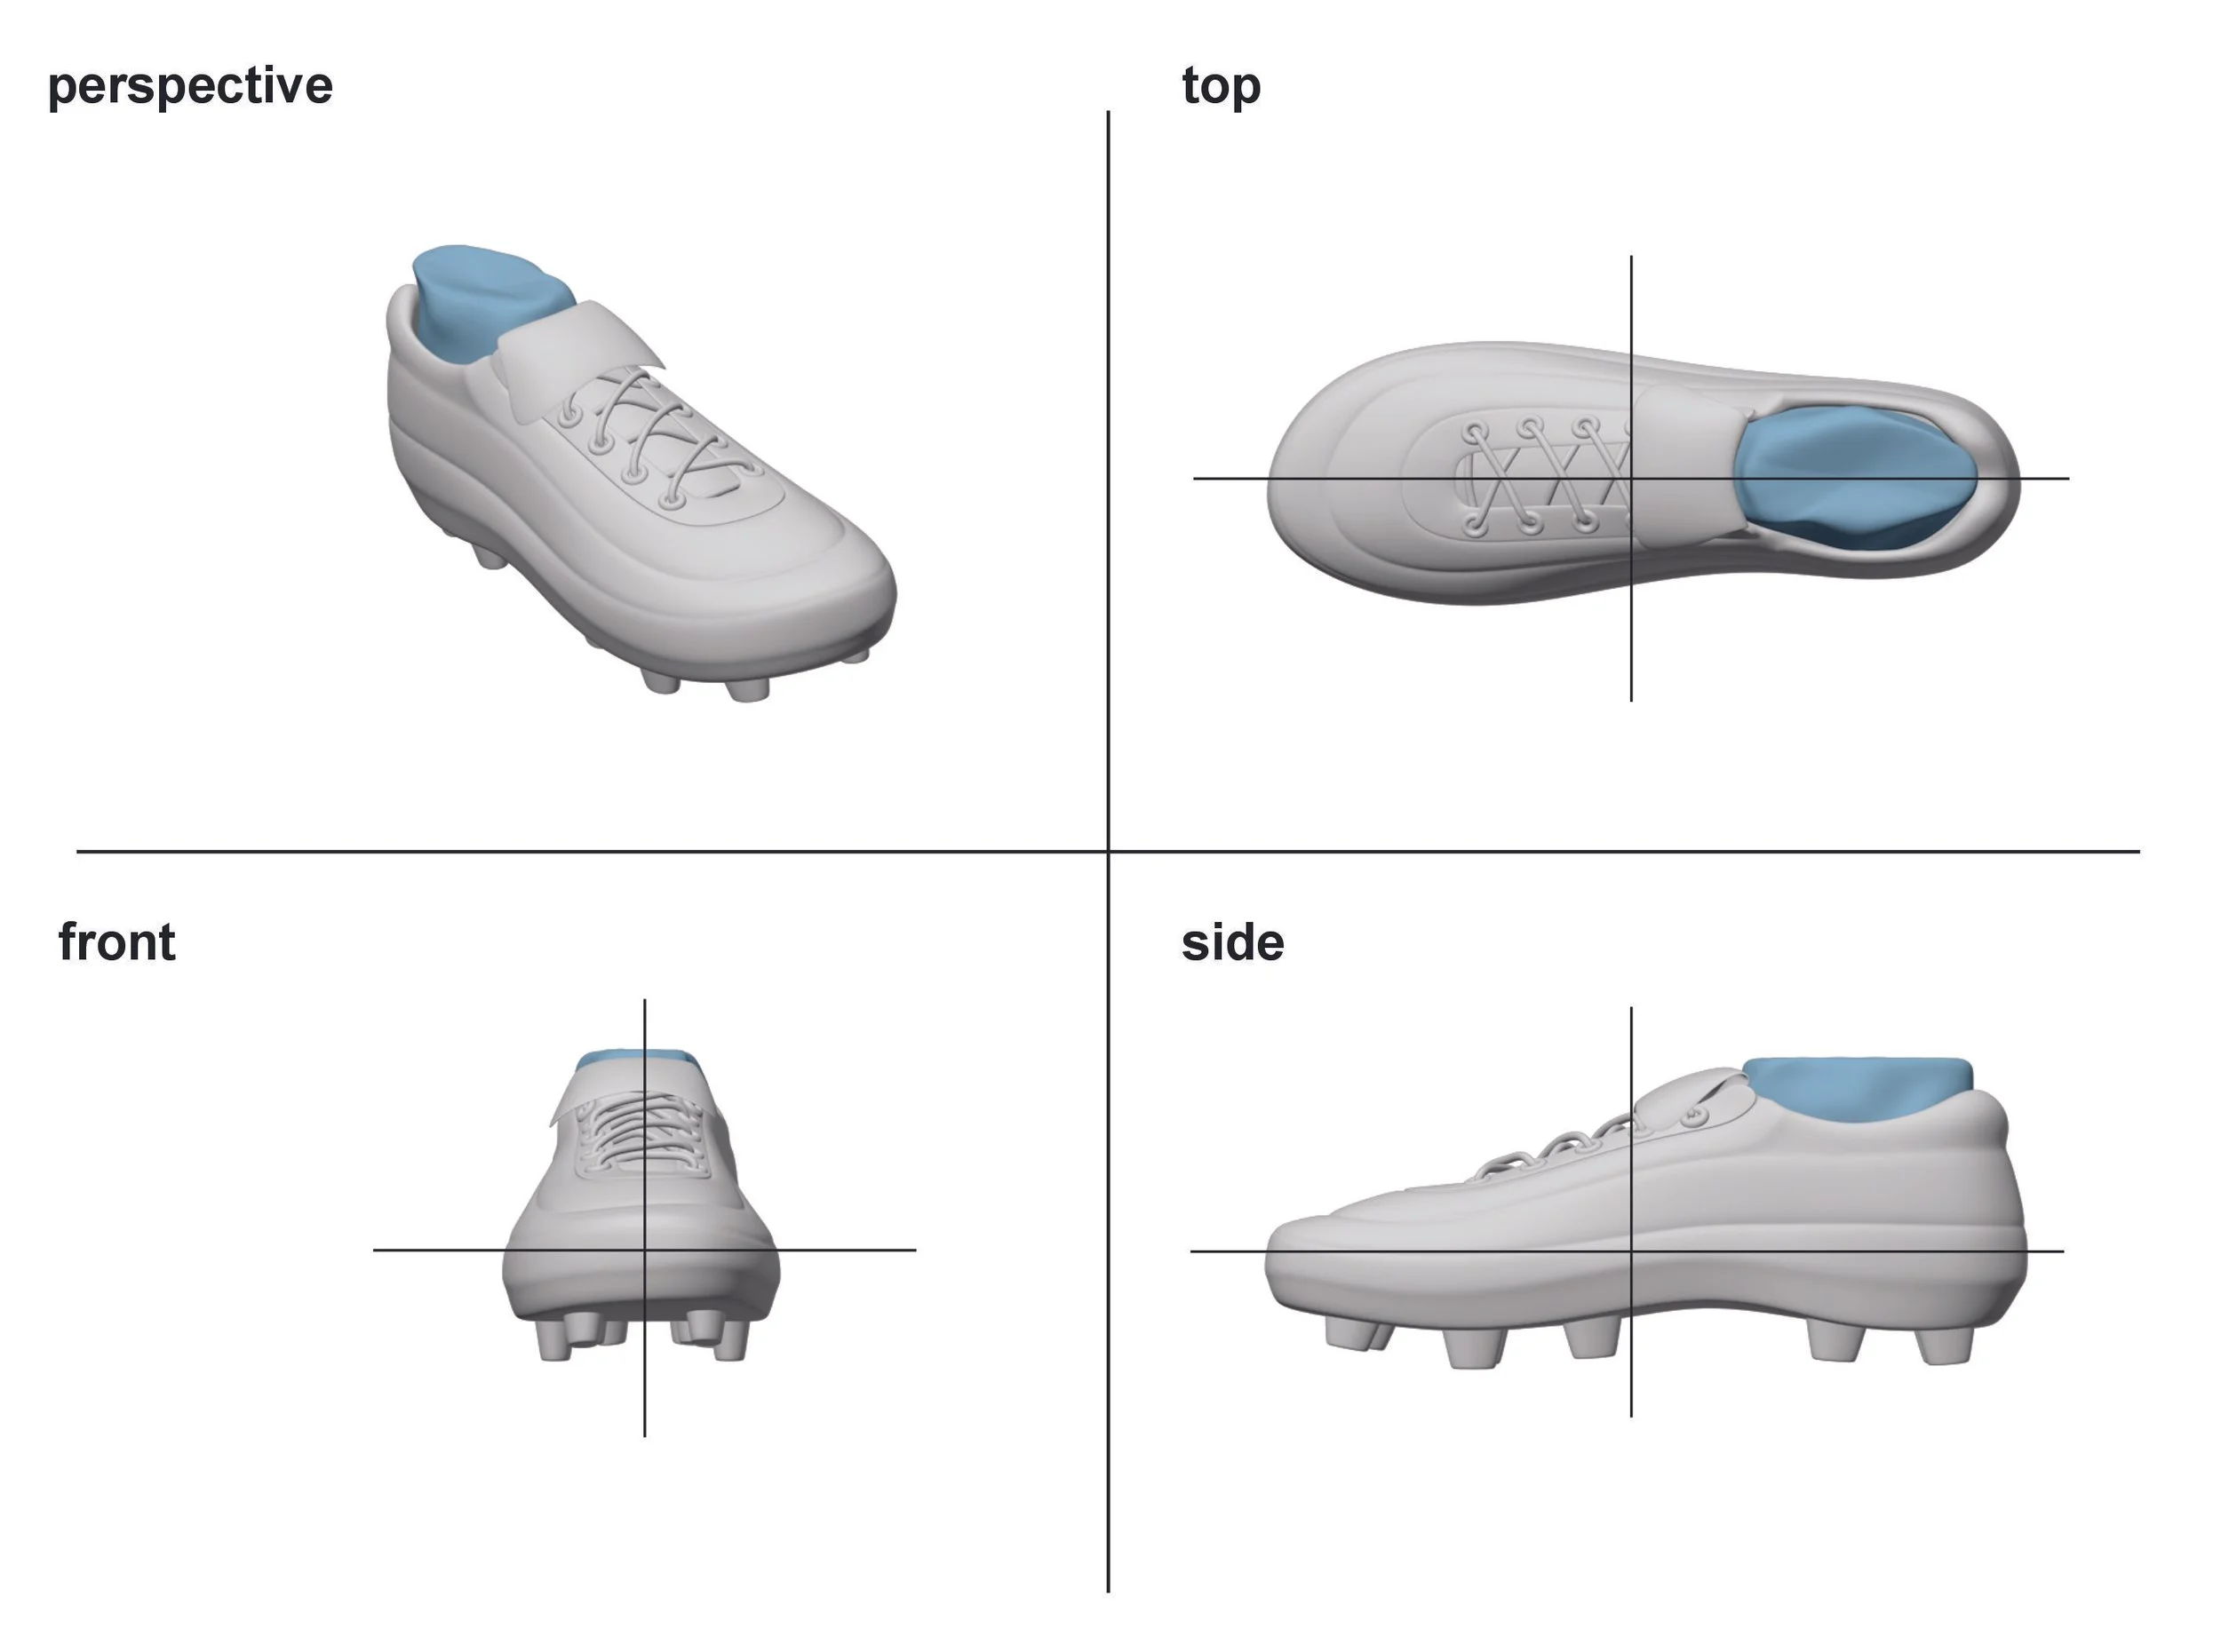
Visual 04
This visual shows the foot divided into contact zones. Each zone can be labeled to help students remember which part of the foot was used. The perspective can be adjusted depending on the action.
By combining ball and foot surface representations, students can clearly understand how they interact at the moment of contact. This visual understanding forms the basis for the assessment process.
2. Student Assessment of Ball–Foot Contact
In the following section, we present the assessment of two students, identified in the previous study as S01 and S05. The assessment focuses on the visual representation of the approach, serving as an introductory demonstration of the assessment method.
The objective is to highlight deviations in the obtained values and demonstrate how these deviations can be detected for further analysis. The overall quality of kicking performance will not be evaluated.
2.1 Observing Ball–Foot Contact Using a Measured Grid
This part introduces the frames captured during the students’ performance. We observe two different moments of foot–ball contact from two different camera views. The footage is followed by a grid that is used to determine the dimensions in the footage and to calibrate the recorded objects, which are later used for the construction of the 3D simulation.
The following Visual 05 represents the footage of S01, and Visual 06 represents the footage of S05.
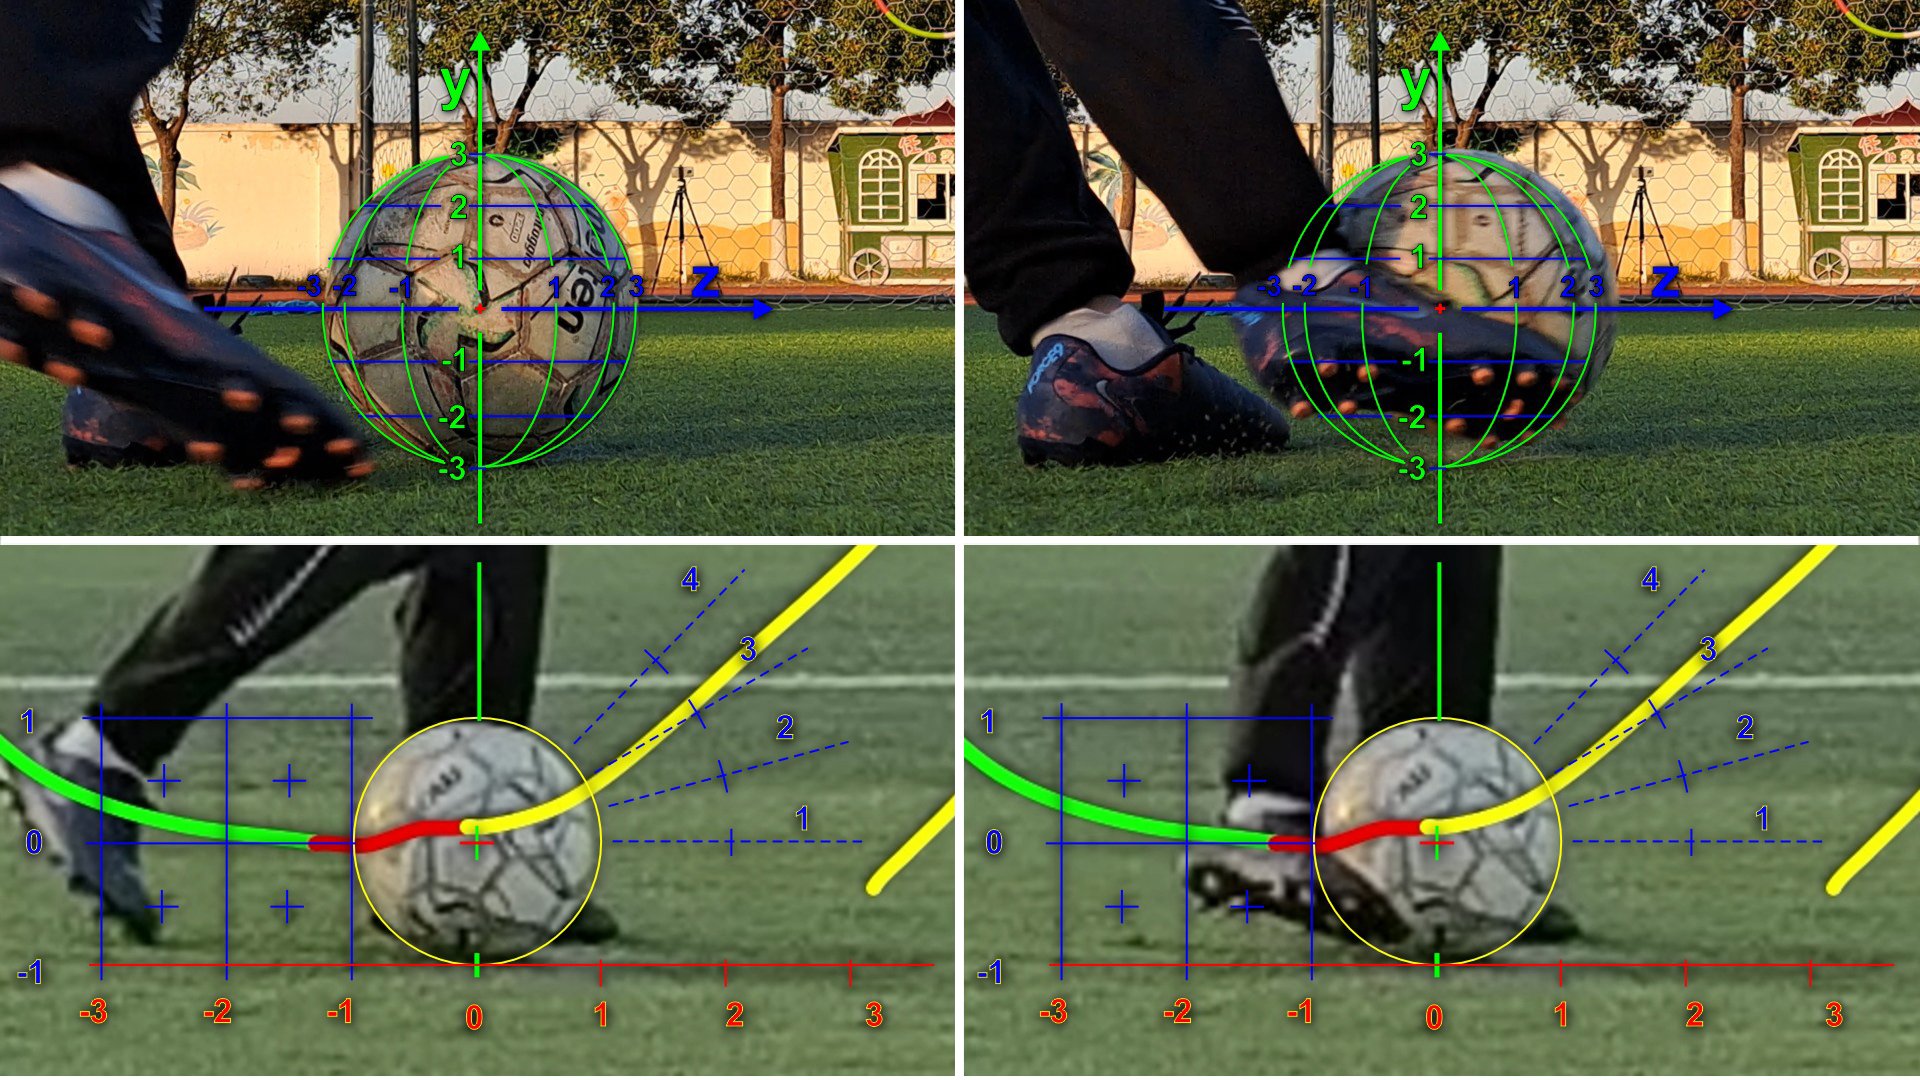
Visual 05
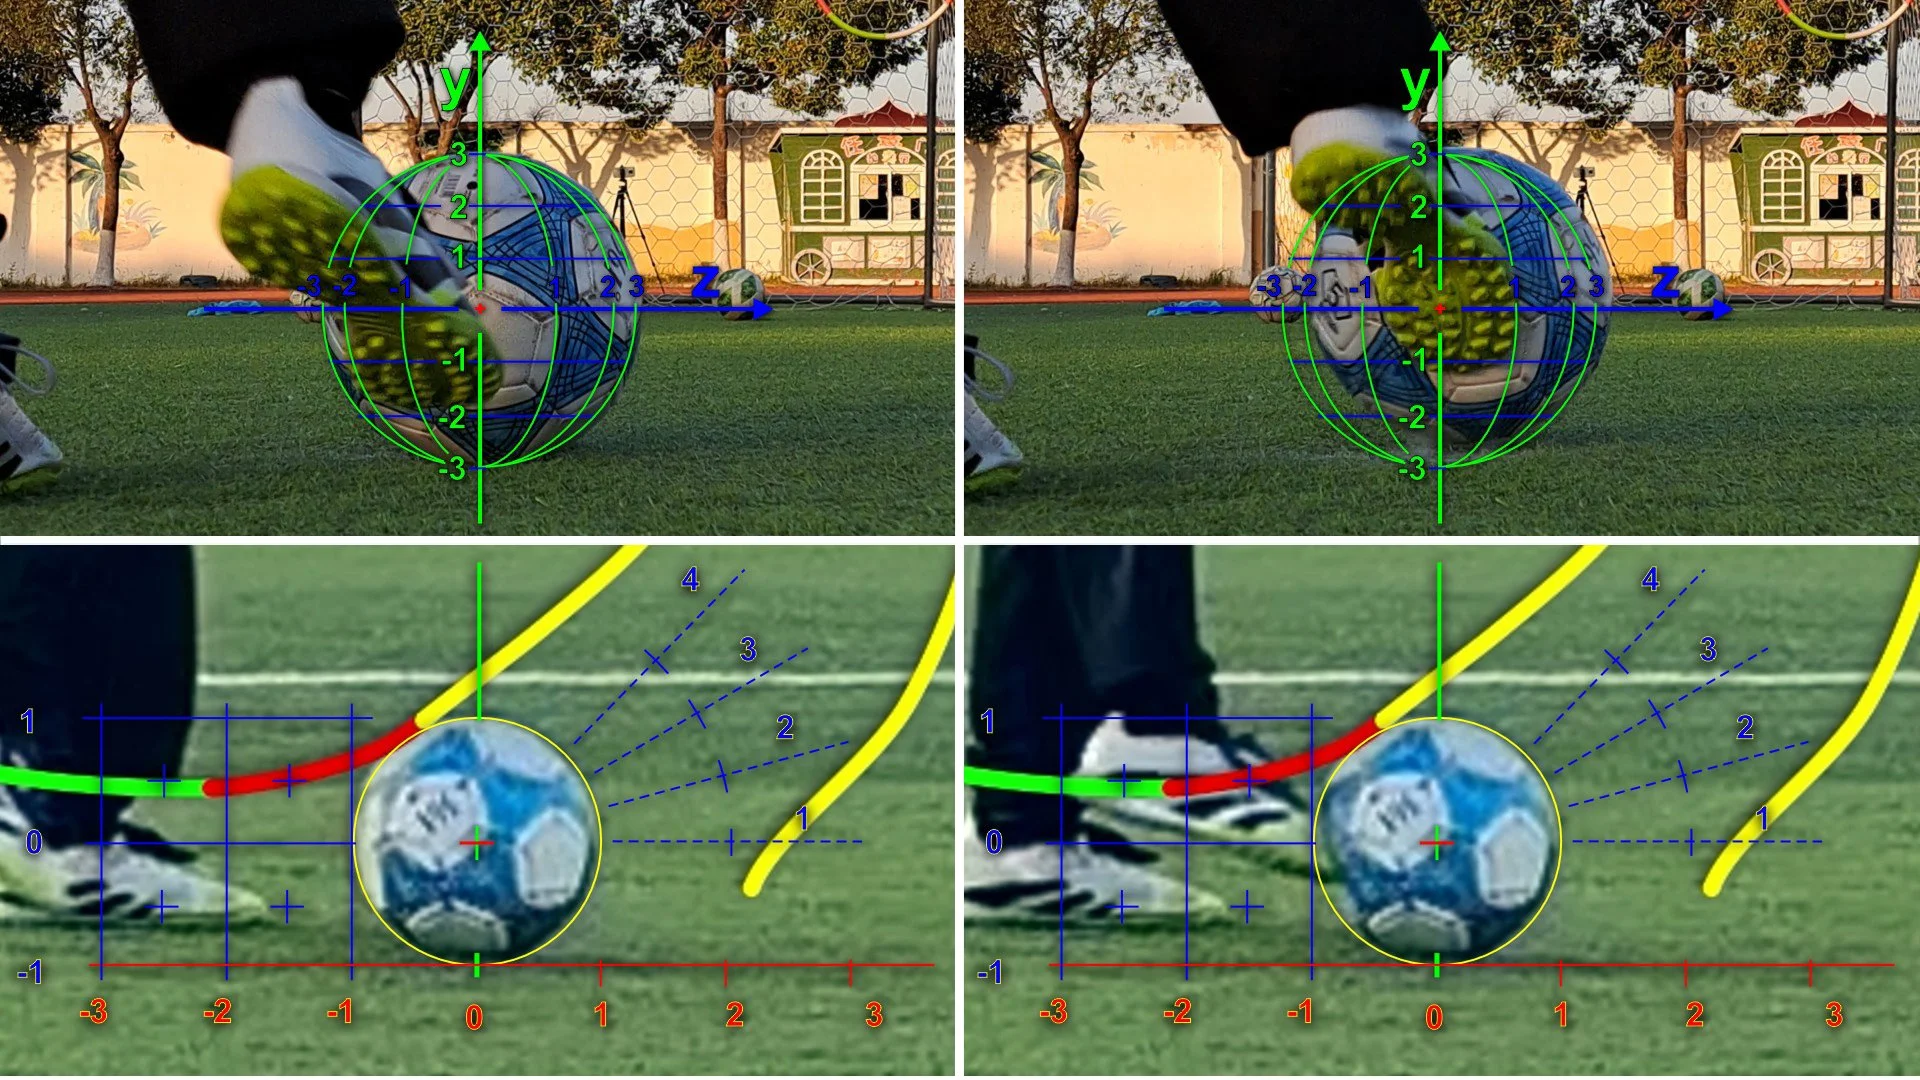
Visual 06
2.2 3D Simulation of Ball–Foot Contact
The following visuals are 3D models constructed from the references shown in the previous two visuals..
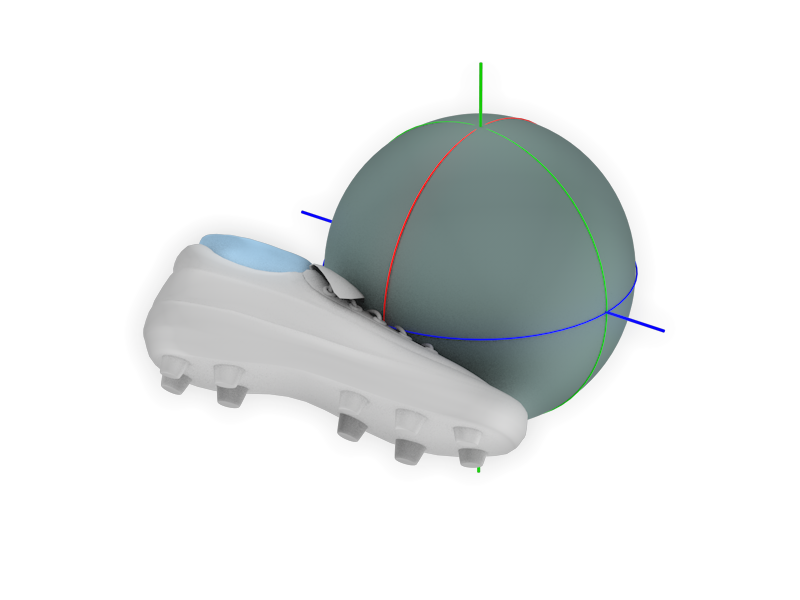
Visual 07
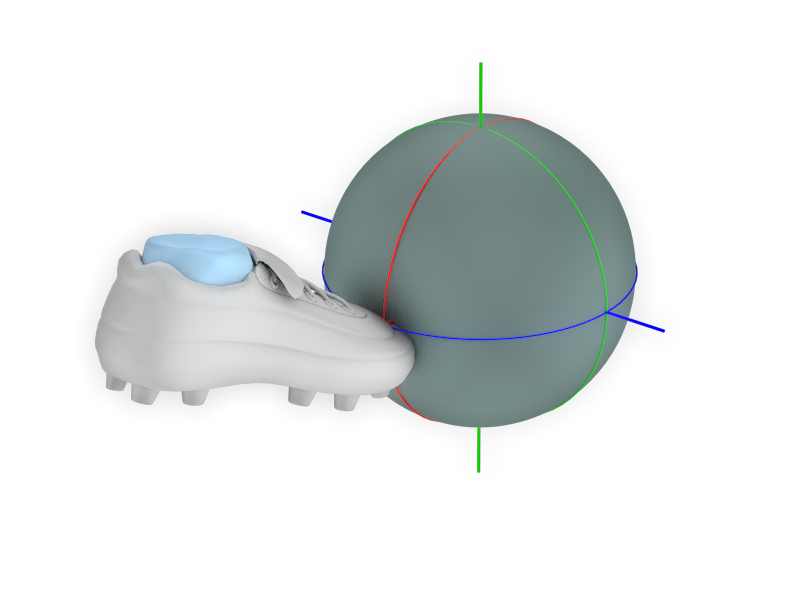
Visual 08
2.3 Visual Representation of Foot Surface Contact
The following visuals show how the contact areas on the foot are identified and labeled during the contact. Each example highlights different contact zones, allowing us to compare and understand the variations between the two students’ techniques.
Visual 09
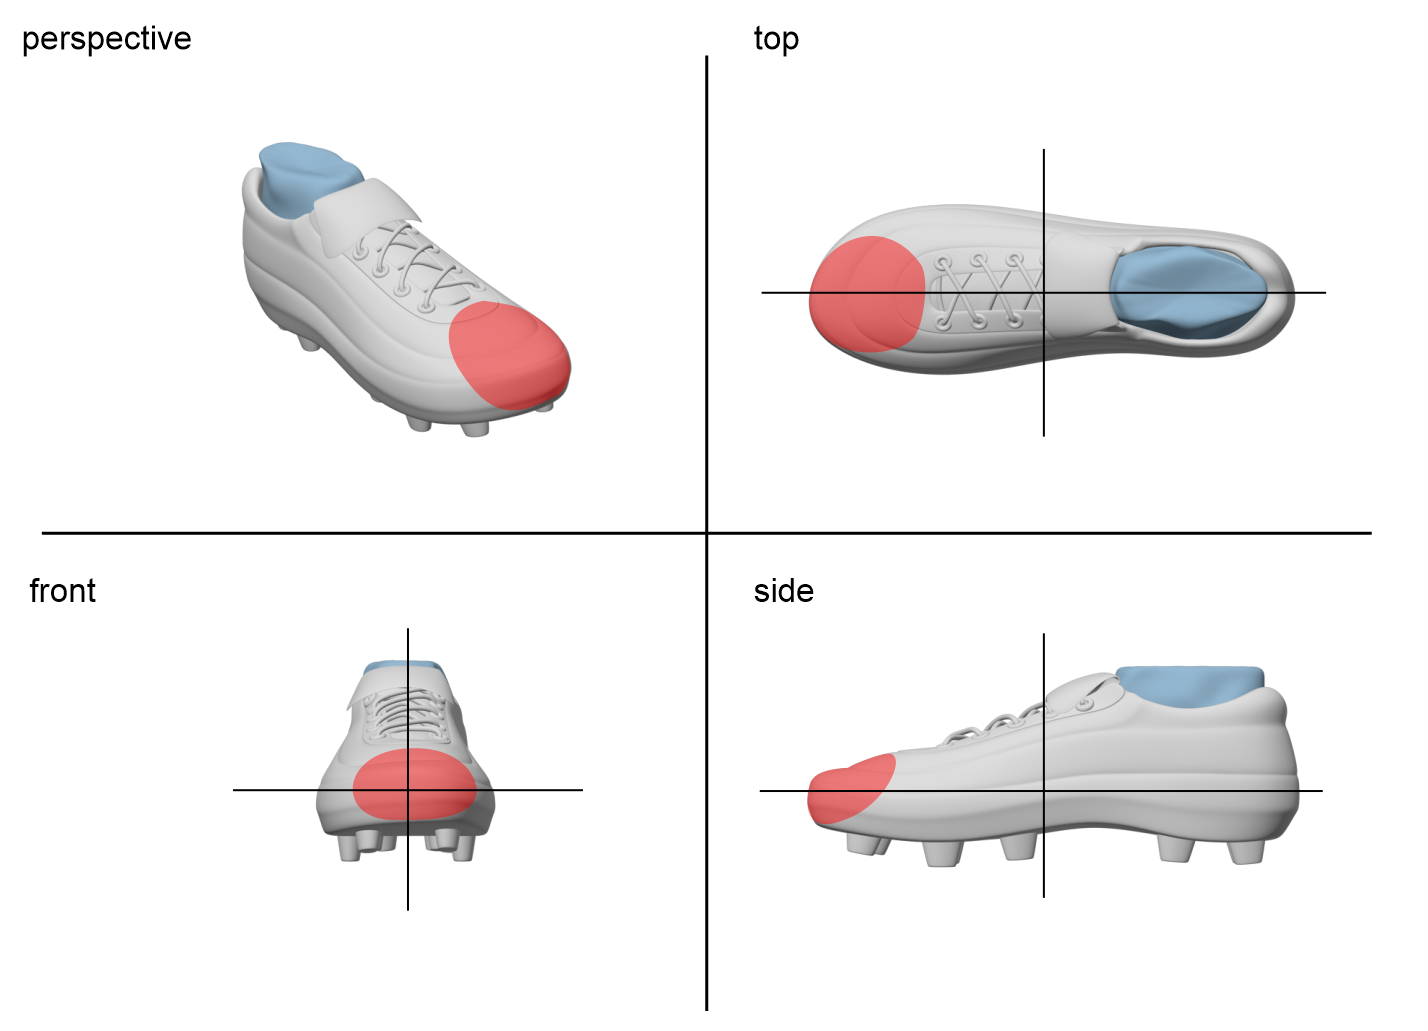
Visual 10
2.4 Relationship between ball contact location and foot attack direction.
The following visuals show how the contact areas on the ball are identified and labeled during contact. Each example highlights different contact zones. The green arrow indicates the direction of the foot attack toward the ball from different views. The visuals also show the relationship between the ball’s center and the foot attack direction relative to the X, Y, Z axes, as well as the latitude (horizontal) lines and longitude (vertical) lines.
This presentation allows us to compare and understand the variations between the two students’ techniques.
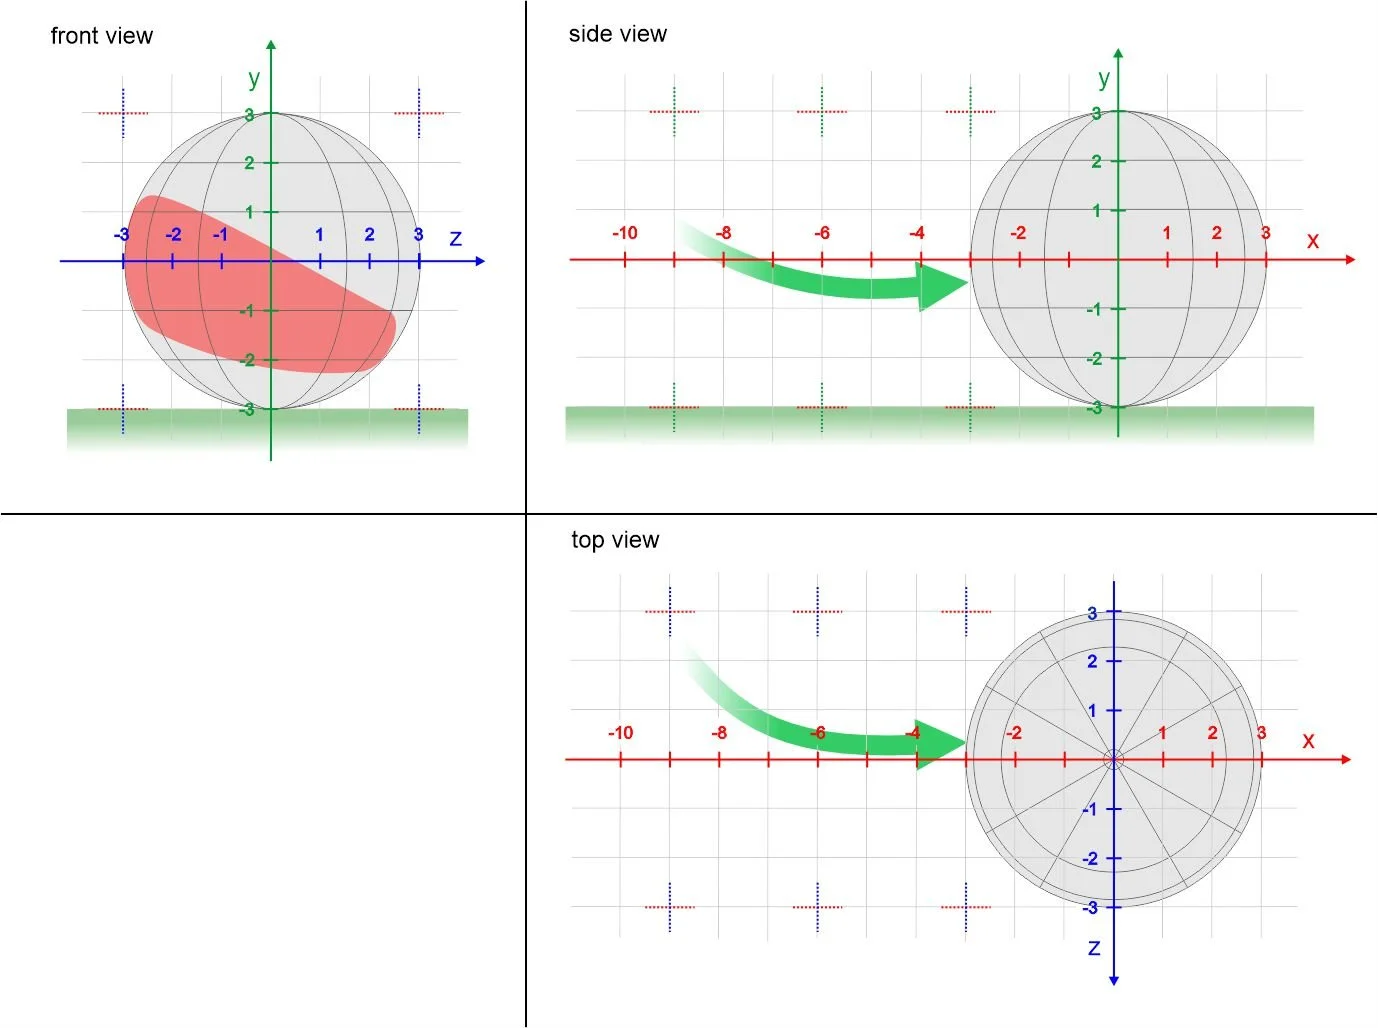
Visual 11
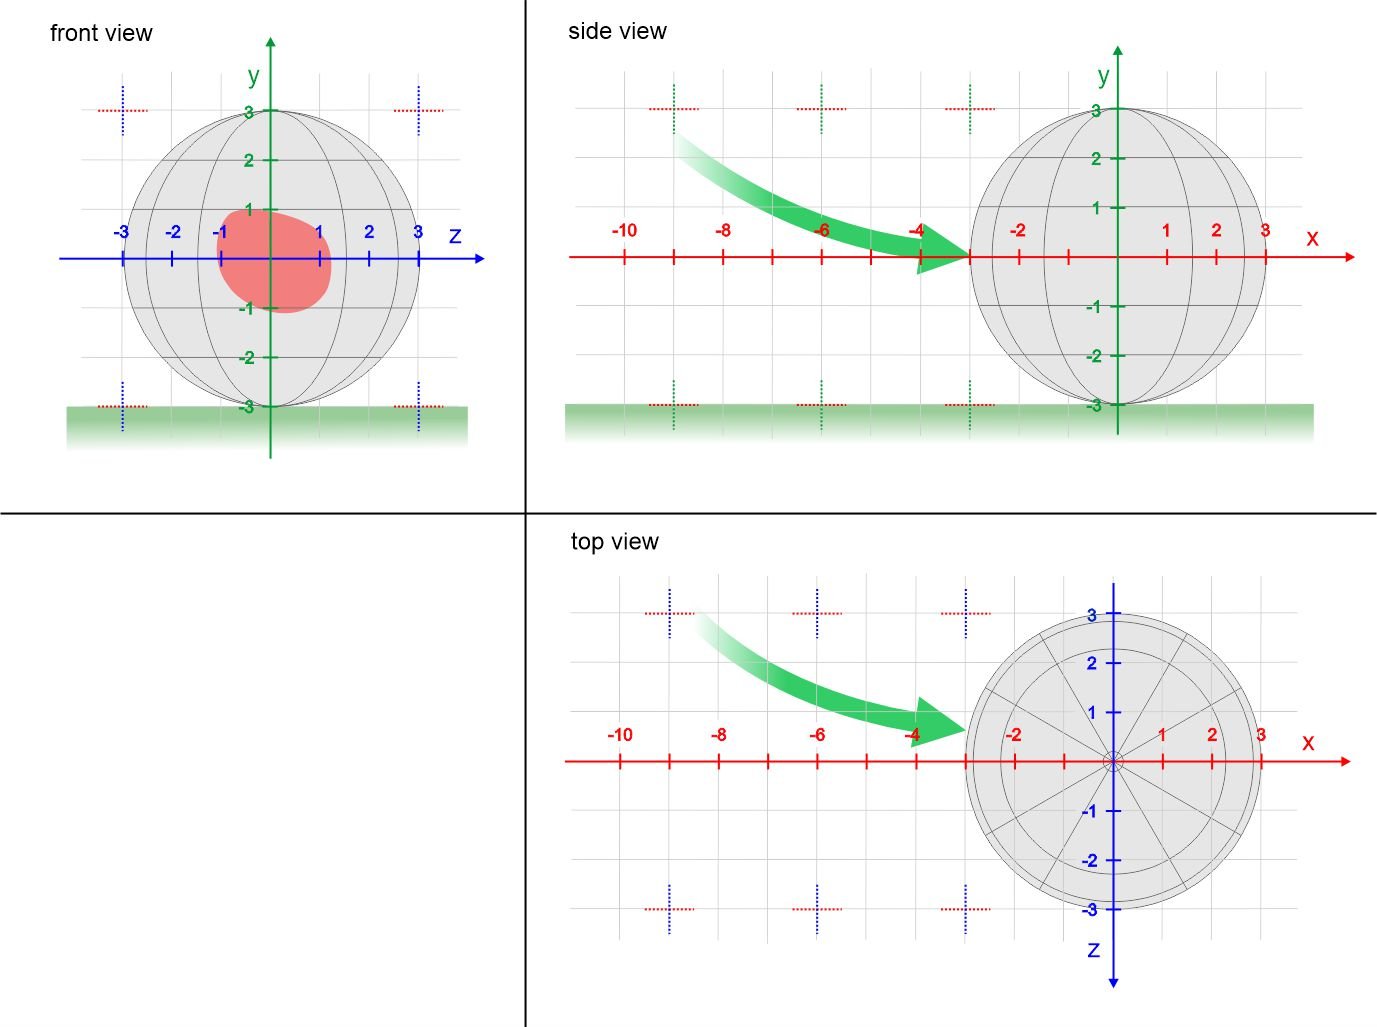
Visual 12
Conclusion
This example demonstrates one possible approach to integrating digital tools into educational practice. While the presented content focused on soccer kicking specifically, the analysis of ball foot contact through visual assessment to support understanding and performance improvement the applicability of such methods extends well beyond this specific context. Innovation and modernization provide significant potential for enhancing teaching and learning processes; however, their impact largely depends on educators’ competencies in selecting, applying, and effectively integrating technological tools into instructional practice.