
ANALYZING KICKING FOOT TRAJECTORIES IN YOUTH SOCCER PLAYERS
Introduction
This study transforms a standard PE session into a modern scientific exploration. By innovating right on the school playground, we recorded and analyzed the kicks of five primary students. From this footage, we extracted precise kinematic data presented here visually and numerically that reveals the core efficiency behind each movement.
Our goal is dual: to identify early athletic potential through measurable parameters, and to bring innovation into physical education by showing how technology can enhance learning environments.
While this blog focuses solely on the parameters obtained from foot trajectory, the study captured broader data in different forms. It will be omitted on this occasion and presented separately.
Most schools use a similar approach: only total sprint time is recorded, and scoring varies across grade levels.
Content Overview
1. How We Captured the Kicks
2.The Trajectory of the Kicking Foot
3.Phases of the Kicking Motion and Trajectory Division
4. Measured Parameters
5. How We Measured Each Parameter
6. How Five Young Kickers Compare
7. Conclusion
1. How We Captured the Kicks
At the outset, we defined a kicking action suitable for the age and skill level of our young participants: each student took a strike from a distance of 10 meters, aiming for the upper right corner of a standard goal frame.
The action was recorded using multiple cameras on tripods, capturing the movement from complementary angles. Measured distances were marked by cone placement, visible in each frame, to provide clear spatial reference within the footage.
This multi-angle footage, supported by cone-based calibration markers, was later used to reconstruct a detailed 3D simulation—enabling precise extraction of all spatial and kinematic data.
Each student, labeled S01 through S05, performed two kicking attempts. The more successful of the two—determined by technical execution and accuracy—was selected for detailed motion analysis and data processing. This approach ensured that the extracted data best represented each individual’s kicking ability.
2. The Trajectory of the Kicking Foot
The trajectory of a kick serves as a biomechanical signature—one that reveals coordination, force application, and efficiency, as demonstrated in the data obtained and presented in this study. Below, you can see side and rear views of the kicking trajectory for Student S01.
While standard video analysis is limited to a flat, two-dimensional plane, our multi-camera setup allowed us to reconstruct the kick in three dimensions. This spatial reconstruction is illustrated below.
Using this 3D simulation, we measured the true spatial path of the foot—capturing its upward, forward, and lateral movement in one integrated model. This comprehensive approach allowed us to analyze the motion more accurately than any single camera angle could achieve.
3.Phases of the Kicking Motion and Trajectory Division
As noted earlier, the overall kicking trajectory is segmented by different colors. This is because the kicking technique was analyzed across four sequential phases, each marked along the foot’s path by a specific color.
Preparation Phase (Blue): The leg moves backward while the supporting leg stabilizes the body, allowing muscles to stretch and build potential energy for the kick.
Acceleration Phase (Green): The leg swings forward, rapidly increasing foot velocity as most of the mechanical energy for the kick is generated.
Contact Phase (Red): This marks the momentary impact when the foot strikes the ball and transfers momentum.
Follow-Through Phase (Yellow): The leg continues its forward motion while slowing down, ensuring controlled deceleration and postural balance.
Using colored phase deviations allows us to visually break down the kick, providing deeper insight into timing, rhythm, and biomechanical efficiency throughout the entire motion.
4. Measured Parameters
As described earlier, our 3D simulation of the foot’s trajectory provides insight into spatial distance measurements. The color-coded segmentation allows us to determine the trajectory length of each phase, and the footage enables precise timing measurements within each stage.
Collecting these values gives access to a wide range of parameters and their interrelationships—an analysis that could easily become an endless pursuit, with many individual nuances omitted here for clarity.
In the section below, we present the measured values we consider most important for evaluating kicking technique efficiency. These are shown for Student S01 in both table and radial chart form.
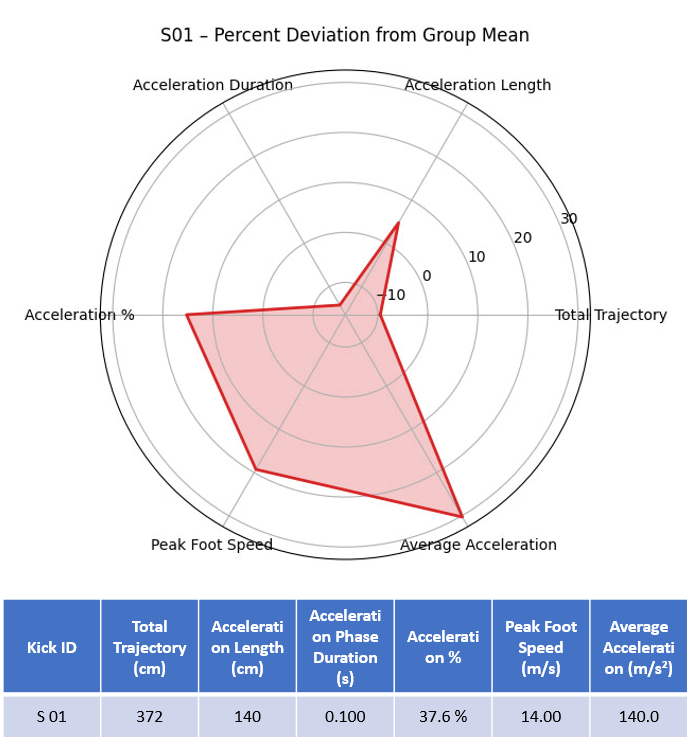
5. How We Measured Each Parameter
Here’s a simple breakdown of how each key metric was captured and calculated—so you know exactly what the numbers mean.
Total Trajectory (cm)
How we got it:
We tracked the kicking foot frame-by-frame—from the moment it started moving until it touched the ground after the kick. Adding up all the tiny distances it traveled gave us the total path length.
Acceleration Length (cm)
How we got it:
We identified the exact frame where the foot began its acceleration—the start of the green segment in the trajectory. Then, we measured the distance traveled from that point until the foot contacted the ball. This gives us the distance used to build speed before impact.
Acceleration Phase Duration (s)
How we got it:
We timed how long it took—from the first move until the foot hit peak speed. This tells us how long the foot was accelerating.
Acceleration (%)
How it was calculated:
"Acceleration %"="Acceleration Length" /"Total Trajectory" ×100
This shows what portion of the entire kick was spent accelerating.
Peak Foot Speed (m/s)
How it was calculated:
"Peak Foot Speed"="Acceleration Length (in meters)" /"Acceleration Duration"
This is simply the fastest speed the foot reached before hitting the ball.
Average Acceleration (m/s²)
How it was calculated:
"Average Acceleration"="Peak Foot Speed" /"Acceleration Duration"
This tells us how quickly the foot gained speed during the acceleration phase.
Put simply: We tracked where the foot moved and how long it took, then turned that into clear numbers you can compare and learn from. No guesswork—just motion turned into meaningful metrics.
6. How Five Young Kickers Compare
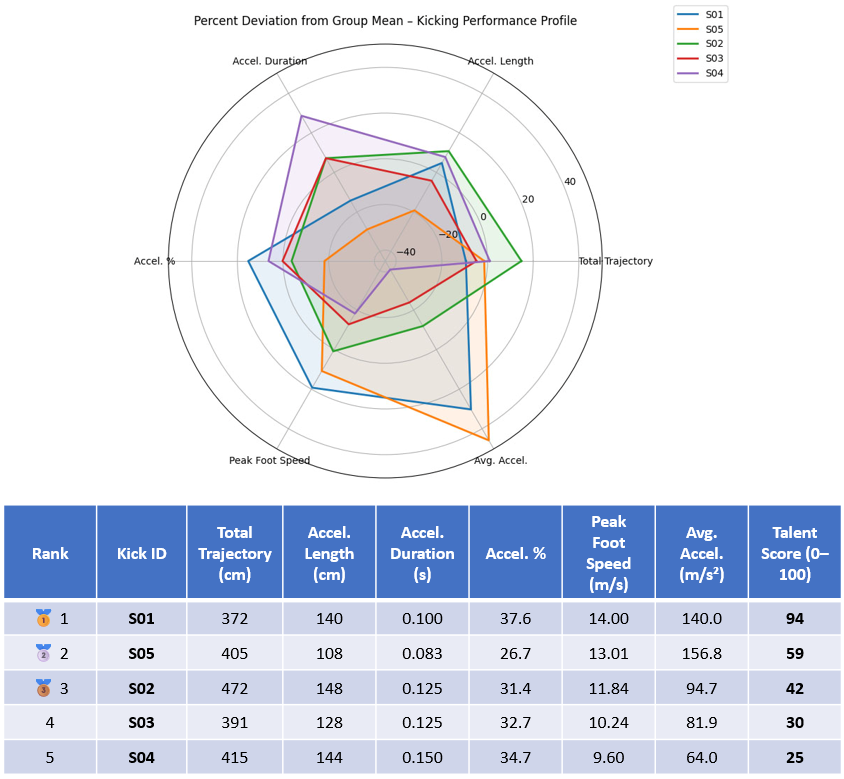
Having laid out how we measured each aspect of the kick, we can now compare the results across all five students. This section puts the data for S01 through S05 side by side.
Below, look at the trajectory shapes for a sample of the students—each as unique as a fingerprint, revealing the personal movement style of the individual.
These unique paths translate into the numbers and chart attached below. The table and radial diagram allow you to spot who excels in speed, who has the longest swing, and where each student stands relative to the group.
A key feature is the Talent Identification Score (0–100), a single number that synthesizes all metrics to rank their overall kicking efficiency.
7. Conclusion
What began as a simple recording on a school playground has revealed a that every young player’s movement lies a measurable story of potential. A clear, data-informed direction for the further development of each young player.
This small-scale study is a starting point. The true goal is to inspire educators, coaches, and youth sports programs to look closer, dig deeper, and use technology not to replace intuition, but to enrich it.
As the author, I view this work not as an end, but as an opening. Where should this approach go next? Your perspective matters—share your thoughts in the comments, as they may shape the direction of our next study and the future of how we understand young talent.