
ASSESSING BALL PATH AND ACCURACY IN BALL KICKING
Introduction
In the first part of this series, we focused on the student’s approach to the ball, exploring the trajectory of the kicking foot in the study titled “Analyzing Kicking Foot Trajectories in Youth Soccer Players.” In the second part, we examined the moment of contact between the foot and the ball in “Making Ball–Foot Contact Visible in Kicking Performance,” where we used visual assessment to make this action easier to observe and support the evaluation process with clear visuals. Now, in this third part, we move beyond the moment of impact and observe what happens after the kick. By visually assessing the ball’s path and accuracy, students can finally see the result of their technique, understand why the ball travels the way it does, and record the action through visual form.
Content Overview
1. Setting Up the Target
2. Understanding Ball Trajectory Through Visual Representation
3. Rotation of the Ball on Its Path
4. Hitting the Target and Scoring Accuracy
5. From Visuals to Table
6. Comparing Student Performance
7. Conclusion
1. Setting Up the Target
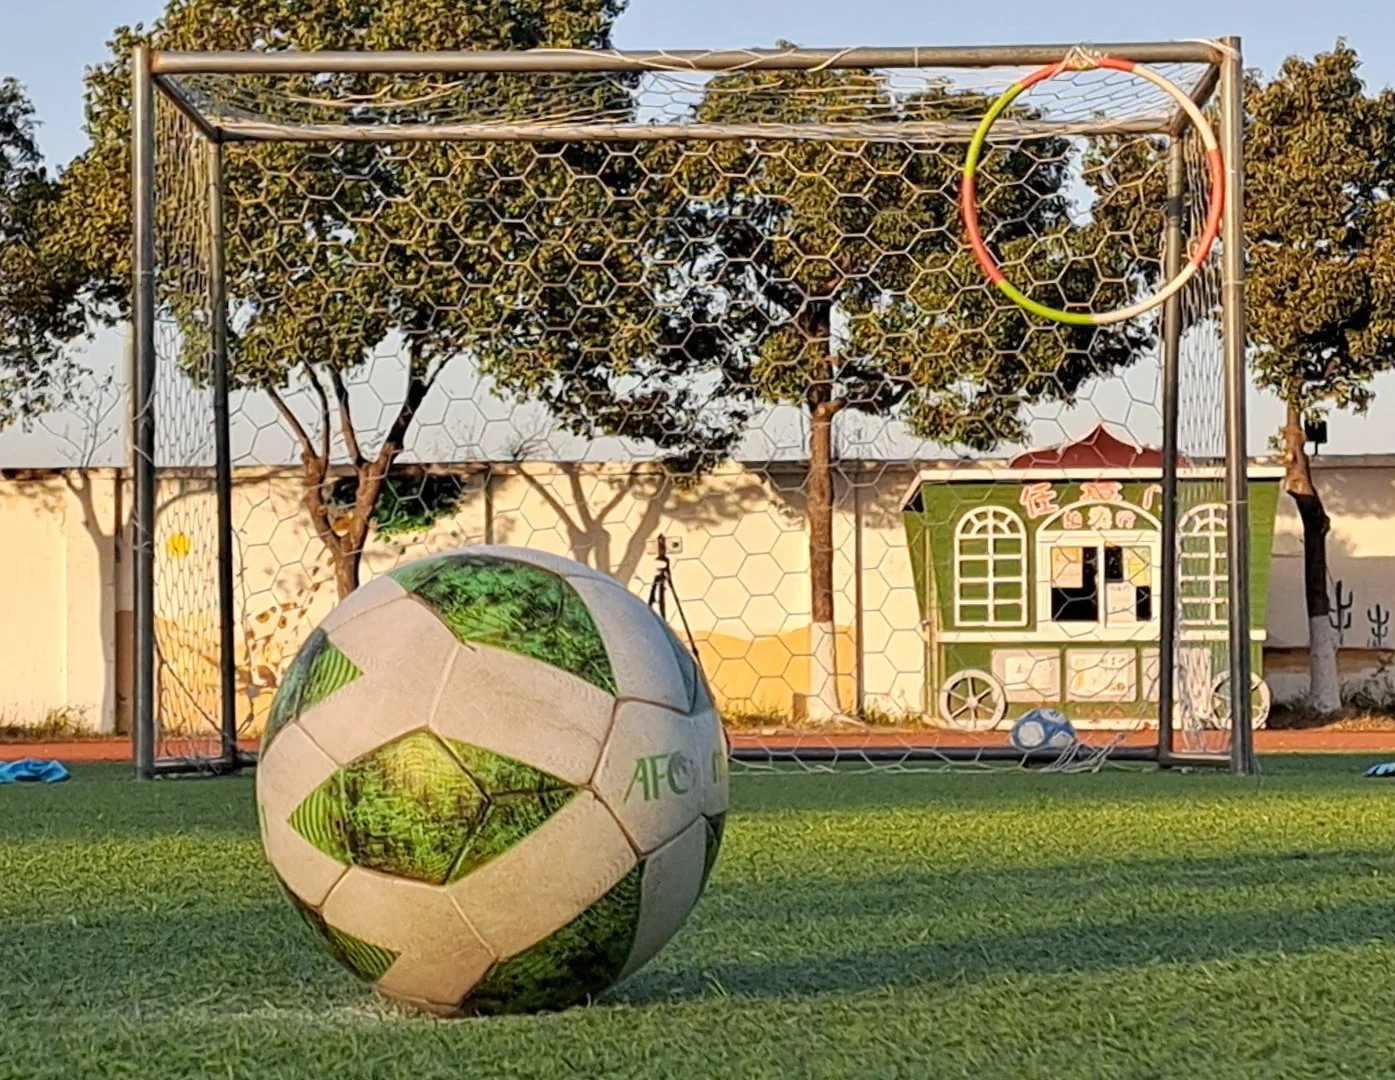
The distance between the ball position and the goal was set at 10 meters. To assess ball path and accuracy, we created a clear target area using a circular hoop with a radius of 33 cm, which was attached to the right upper corner of the goal.
Visual 01
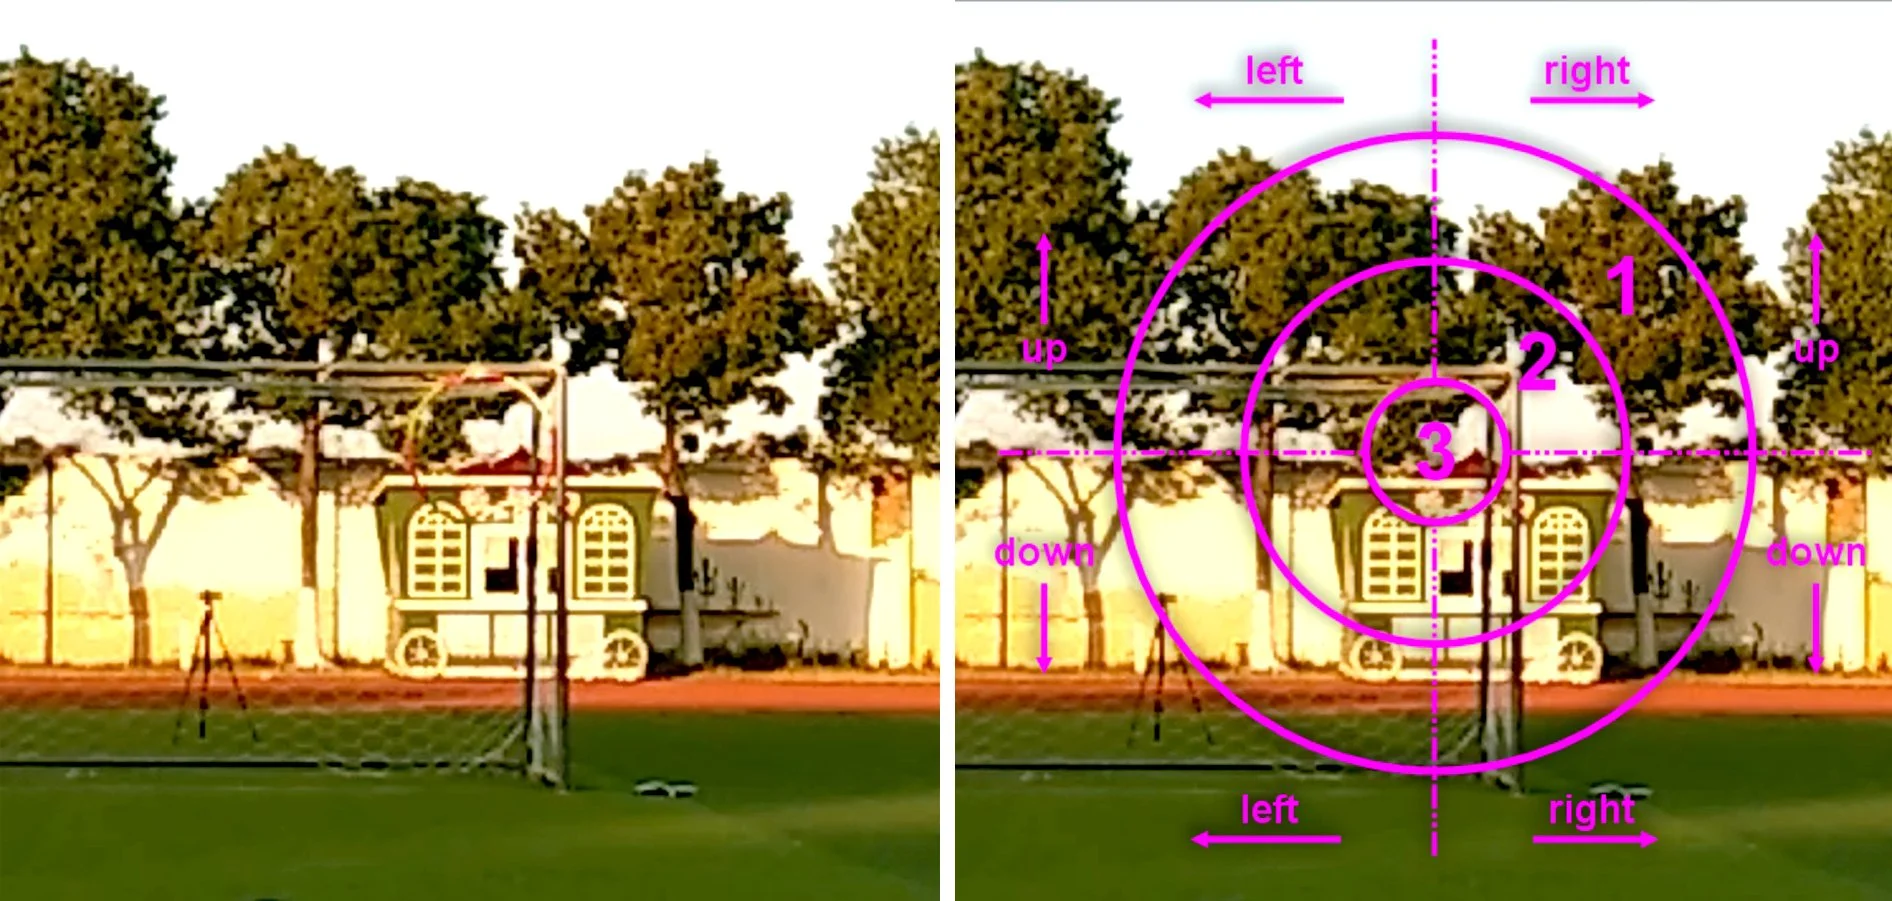
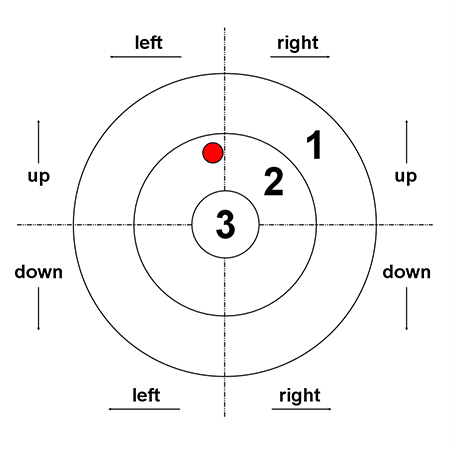
In the digital form, the target was designed with a scoring system: a successful hit inside the hoop was scored as 3 points, while additional target zones were added to show varying levels of accuracy. The larger circle represented a 2-point zone with a radius of 100 cm, and the outer circle represented a 1-point zone with a radius of 165 cm. Zone 3 represents the highest accuracy, Zone 2 and Zone 1 indicate lower accuracy, and Zone 0 means a miss. The assessment also considered whether the ball hit the upper or lower area of the target and whether it landed to the left or right side.
Visual 02
This setup allowed students to compare their results over time and understand how small changes in technique affected the outcome of their kicking performance. It also enabled reliable visual data collection, making the assessment more meaningful and easier to review.
2. Understanding Ball Trajectory Through Visual Representation
The visual presents the kicking action using several synchronized views, beginning at the moment the foot contacts the ball and continuing as the ball moves toward the goal and into the target areas. By following the ball after impact, students can observe how its direction, height, and curve are shaped by the kicking action.
Visual 03
These multiple views are calibrated to generate a three-dimensional representation of the ball’s flight, allowing the movement to be examined from angles that were not directly recorded by cameras. This provides a broader perspective on the action and supports a deeper understanding of how the kick influences the ball’s movement. Along with the animation, a digital overlay displays concentric target zones and a scoring system, offering a clear structure for evaluating accuracy.
Visual 04
This visual assessment approach helps students relate their kicking technique to the final result and better understand how their movements affect the ball’s path.
3. Rotation of the Ball on Its Path
When a ball is kicked, it does not only move forward — it also rotates. This rotation influences the ball’s movement while it travels through the air and can cause the ball to curve slightly toward or away from the target. For this reason, the objective is not to produce maximum spin, but to develop controlled rotation that supports accuracy and control.
Visual 05
The visual above illustrates the ball’s rotation using a 3D simulation. Ball rotation was analyzed based on the previously presented video footage and then transformed into a simulation representing the ball’s rotational behavior. This simulation corresponds with the previously presented visualizations (Visual 03 and Visual 04), and their connection demonstrates how ball rotation occurs during flight and how it influences the ball’s path toward the target.
Ball rotation can occur in different types and directions, and it may change during flight. However, to maintain simplicity and adapt the assessment for younger learners, only the initial type of rotation is presented in this chapter. Changes in rotation that occur later during the ball’s flight are intentionally omitted.
In summary, understanding ball rotation supports students in developing better kicking accuracy and overall ball control.
4. Hitting the Target and Scoring Accuracy
Once the ball’s path is visualized, the focus shifts to how accurately the ball reaches the intended target. Each kick is evaluated based on where the ball enters the goal area in relation to the predefined target zones. The scoring system is kept simple and intuitive, allowing students to immediately understand the level of accuracy achieved with each attempt.
Rather than treating accuracy as a simple hit-or-miss outcome, this graded scoring approach helps students recognize how close the ball comes to the intended target. By using clear spatial zones with assigned point values, students can compare different kicks and monitor their progress over time.
Visual 06
This scoring method strengthens visual assessment by turning ball placement into meaningful feedback. Beyond the score itself, each kick is also visually analyzed according to its horizontal (left, center, right) and vertical (low, middle, high) entry point, as well as the observed behavior of the ball during flight. Factors such as height, direction, and visible spin help students link their kicking technique to the final result, supporting a clearer understanding of how technical adjustments influence accuracy and performance.
5. From Visuals to Table
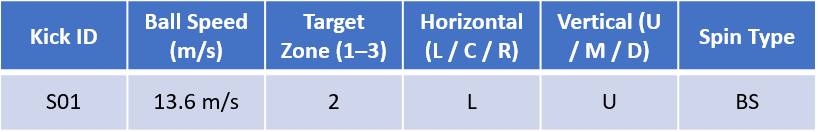
To support the visual analysis, the key results from each kick were recorded in a simple table. Information such as ball speed, target zone, direction, and visible spin was noted for every attempt, making it easy to review all the main outcomes in one place.
Visual 07
While each of these parameters could be explained in more detail, they are intentionally kept brief here to keep the blog clear, focused, and easy to follow.
6. Comparing Student Performance
To better understand the differences within the group, this section examines the performance values of the five participating students. Comparing these results allows us to observe patterns in key aspects of performance. Presenting all detailed metrics in full would make the content too extensive, so they have been omitted here.
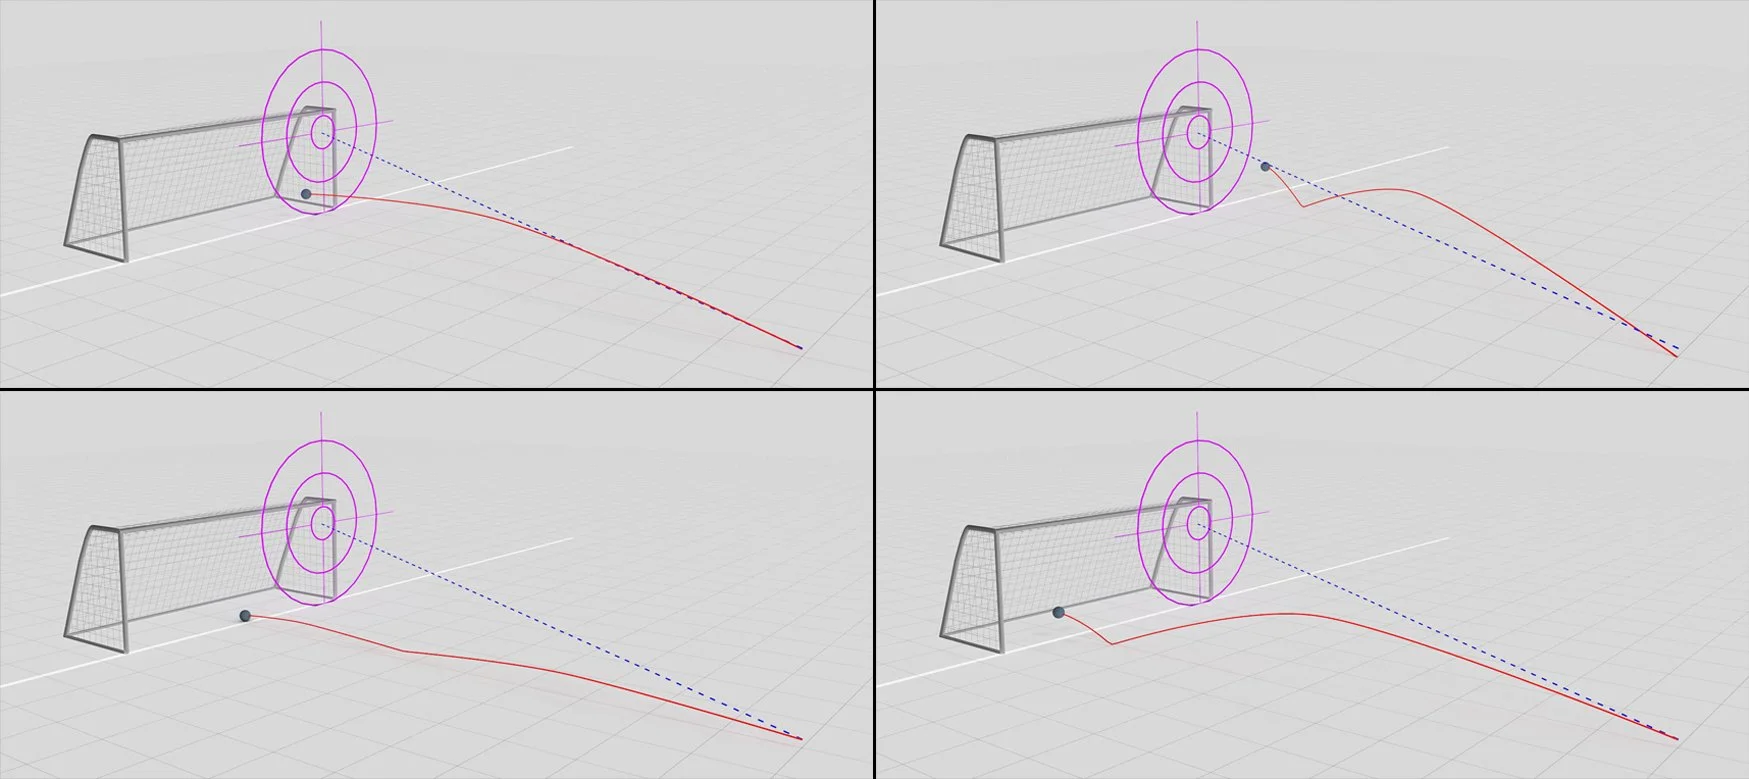
Visual 08
The visual above shows 3D simulation examples of four students, illustrating the differences in ball trajectories and target accuracy.
Visual 09
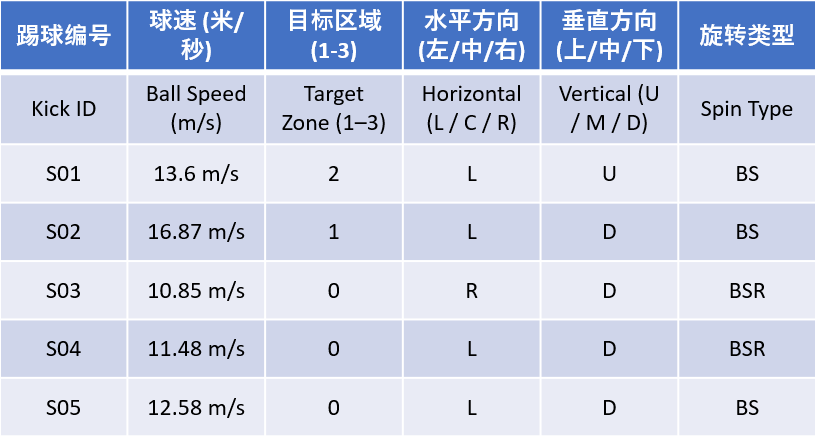
Following this, the table summarizes the collected data for all five students. By organizing the results in a single table, it becomes easier to compare performance across the entire group. Additionally, the graph below visually presents the comparison of achieved ball speeds relative to the intended target.
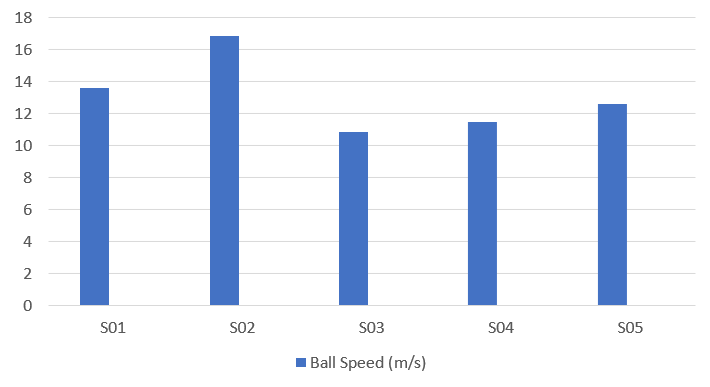
Visual 10
An important observation—linking back to the earlier blog content “Analyzing Kicking Foot Trajectories in Youth Soccer Players”—is that Student S01, who achieved the highest foot acceleration during the kick, did not record the highest ball speed. Instead, the fastest ball in flight was produced by Student S02, as clearly illustrated in the graph. This observation opens the discussion about why high foot acceleration does not always result in the fastest ball.
7. Conclusion
In this blog, we analyzed kicking performance in youth soccer players using visual observations and structured data. Tables and visualizations clearly highlighted differences in ball speed, trajectory, accuracy, and spin among participants, making patterns and areas for improvement easy to identify.
This approach shows that digital assessment of the kicked ball is a powerful innovation for educational and coaching settings, providing objective insights, supporting targeted feedback, and enabling more effective training strategies. By combining digital tools with traditional observation, we gain greater precision and understanding in player development.