
RUNNING SPEED ASSESSMENT OF CYCLE TRAJECTORIES
Introduction
Running speed is usually evaluated through time and distance results, but these outcomes do not show how each stride is structurally formed, which is essential for understanding running technique and achieving higher running speed in an individual runner. In addition to other parameters, each running stride can also be observed through its trajectory, which provides valuable insight into movement structure and technique.
The following content presents a practical trajectory-based assessment model for the running stride. It focuses on visually derived closed trajectories and the key quantitative metrics that can be extracted from them. The aim is to show how these values differ between runners and how they support a more detailed and individually targeted assessment of running technique.
Content Overview
1. Method Overview
2. Values of Cycle Trajectories
2.1. Visual Results
2.2. Numerical Results
3. Deviation Interpretation and Practical Assessment Value
4. Conclusion
1. Method Overview
The assessment model was applied in a school setting on a running track. A recording setup was organized with defined camera placement and distance markers (LINK). Since each runner reaches maximal speed at a different point on the track, an identification method was used to determine the individual maximal-speed achievement zone. Based on this zone, the recording setup was further adjusted for each runner (LINK).
Runs were recorded using multiple cameras, while the side-view camera was used to clearly capture the foot movement trajectory for further analysis. The extracted stride cycle was divided into phases using color coding, as explained in the previous blog (LINK).
Two metric groups were applied: visual metrics (trajectory shape and phase proportions) and numerical metrics (total curve length, phase share, and contact-time percentage). Comparing these values between runners helps reveal stride-structure differences and provides a basis for individually tailored training programs.
2. Values of Cycle Trajectories
To demonstrate how cycle trajectory assessment works in practice and how it reveals individual deviations between runners, results are presented using both visual and numerical outputs. For each runner, one selected stride cycle was converted into a closed trajectory curve and divided into color-coded phases. A numerical table accompanies each visual and contains metrics calculated from the same trajectory.
Below, the visual form and numerical values are presented for several runners to provide reference examples and show deviations between individuals.
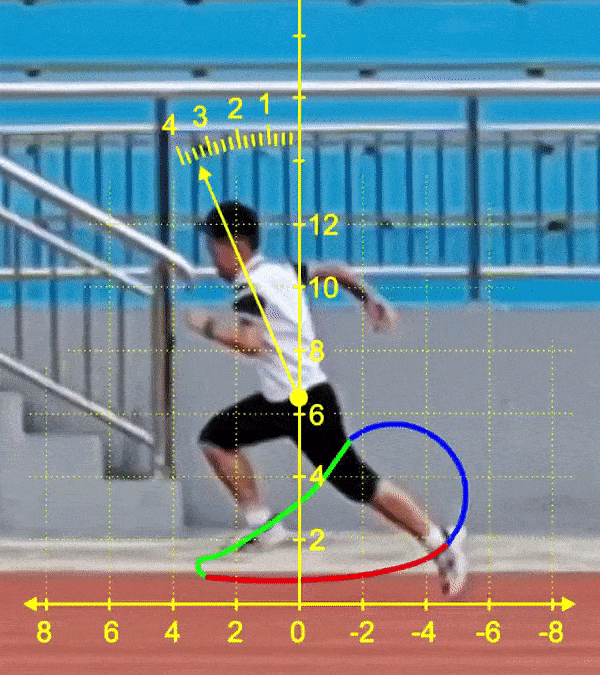
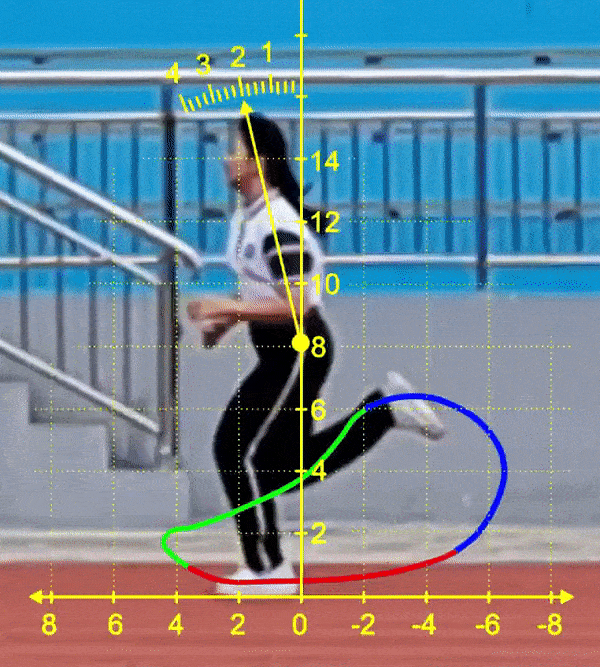
Visual 01
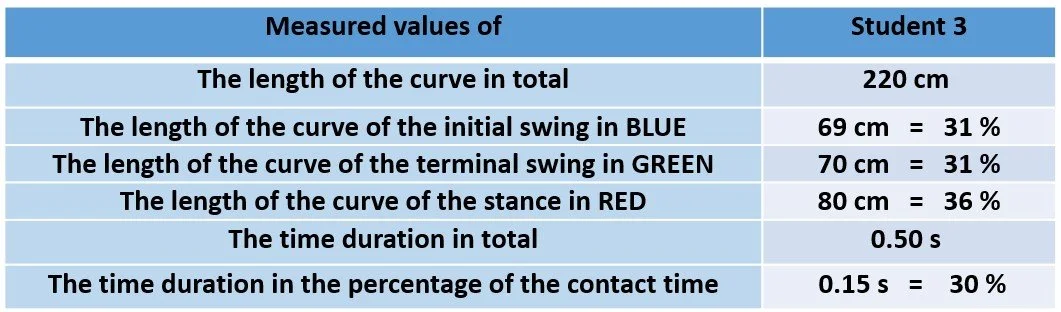
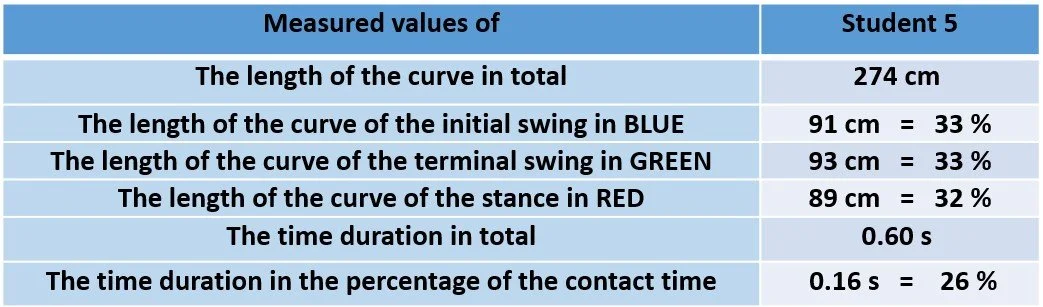
Table 01
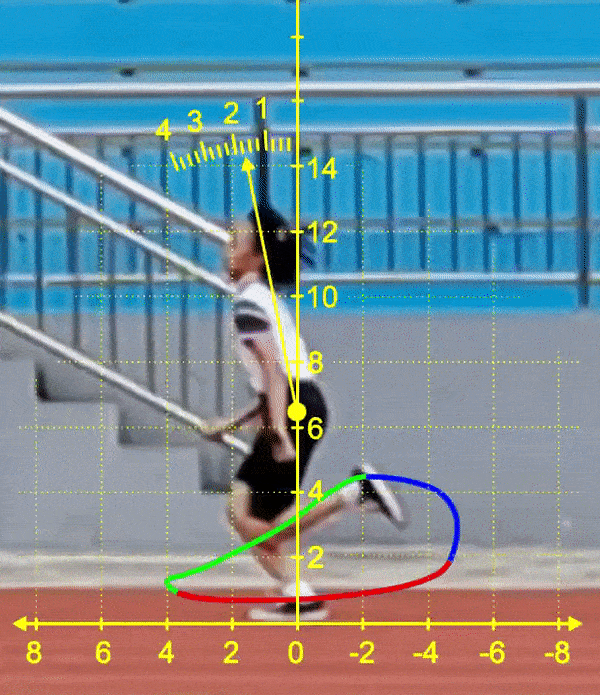
Visual 02
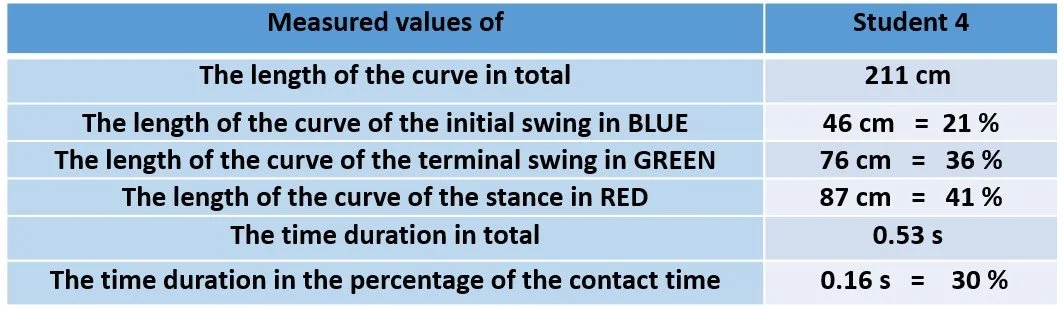
Table 02
Visual 03
Tabele 03
2.1. Visual Results
The visual trajectory curves show the closed stride path formed by the foot during one running cycle. When comparing runners, differences can be observed in:
• overall loop shape
• curve-length segments for each color-coded stride phase (LINK)
• relative phase proportions within the trajectory
Additional vertical and horizontal reference metrics can also be derived, but they are not included here in order to keep the focus on the trajectory curve.
2.2. Numerical Results
Numerical assessment supports objective movement evaluation by quantifying key trajectory properties. These metrics enable more reliable runner-to-runner comparison and allow progress to be tracked across repeated measurements using specific values. Numerical results also support clearer feedback and more precise training decisions based on measured differences rather than visual observation alone.
3. Deviation Interpretation and Practical Assessment Value
Comparing cycle trajectories between runners allows direct assessment of stride-structure deviations using both visual curves and numerical phase metrics. Differences may appear in loop shape, phase proportions, and contact-time share, showing how each runner organizes the stride cycle at maximal speed. The purpose of this comparison is not to rank performance, but to identify structural characteristics of each runner’s technique.
Numerical values confirm visual observations and make deviations measurable. Phase-share percentages and contact-time metrics enable consistent runner-to-runner comparison and support repeatable evaluation over time.
In practical use, this approach helps teachers and coaches detect phase imbalance, recognize stride patterns, and provide individually targeted technique feedback. Because it relies on video analysis and simple metrics, it can be applied in everyday school and training environments by educators with digital-tool skills while still producing structured assessment results.
4. Conclusion
This trajectory-based stride evaluation approach represents an assessment innovation and a step toward curriculum modernization in school settings through the use of digital tools. By transforming simple video recordings into structured visual and numerical evidence, it extends traditional speed testing into technique-informed assessment and supports more advanced learning about movement.
It helps shift the focus from outcome-only evaluation toward understanding movement structure and cause effect relationships in performance. Instead of asking only “How fast?”, this approach helps answer “Why this fast?” a question that leads to meaningful, targeted progress and more informed instructional decisions.