
WILL LOW-COST MOTION CAPTURE REPLACE TRADITIONAL BIOMECHANICS LABS?
Introduction
This article presents results obtained from video-based motion capture and subsequent motion data extraction. The outputs are visualized through 3D animations, graphical representations, and numerical parameters.
It is important to note that the presented pipeline has not yet been formally validated within a research institution. It was developed independently and should therefore be considered exploratory rather than definitive. Despite this limitation, the results indicate the potential of low-cost tools for accessible motion analysis.
Motion analysis can easily become complex and open-ended. For this reason, the scope of this work is limited to a single application: the analysis of a kicking task, used as a practical example to demonstrate the feasibility of low-cost motion capture systems.
Content Overview
1. Video Footage as the Reference
2. Visualization of Motion Values in 3D Space
3. Numerical Values of the Kicking Action and Interpretation
4. Kinetic Chain Visualization Through Graphs
5. Conclusion
1.Video Footage as the Reference
The process begins with recording a kicking task performed by a primary school student. The video data shown below serves as the reference input for the subsequent analysis pipeline.
Visual 01
The recording is captured using a multi-camera setup with a predefined recording protocol. Proper camera arrangement and calibration allow the extraction of spatiotemporal data (x, y, z coordinates over time).Once the video data is prepared in the required format, it can be processed to reconstruct movement in a 3D environment. This enables further calculations and structured analysis of motion, forming the basis for biomechanical interpretation and performance evaluation.
2. Visualization of Motion Values in 3D Space
In 3D reconstruction, the primary objective is to maintain simplicity and prioritize the observation and interpretation of movement over visual complexity.
Visual 02
This visualization shows joint positions connected using spline-based links, forming a hierarchical skeletal structure of the body. In addition, the trajectory of the right ankle joint is displayed. The trajectory is color-coded according to phases of the kicking action: preparation (blue), acceleration (green), contact (red), and follow-through (yellow).
Visual 03
The reconstructed 3D model allows manipulation of the scene in space and time, enabling multi-angle analysis of movement. This example presents a frozen frame, which supports the observation of body posture and trajectory from different viewpoints. The purpose is to move beyond single-camera interpretation and allow spatial inspection of movement structure.
Visual 04
This visualization includes a skeletal model with the center of mass (COM) marked as a red point, which follows the body’s motion and generates a trajectory during movement. Although primarily a visual tool, it also provides a basis for calculating key biomechanical variables that can be used to evaluate the efficiency of an athlete’s kicking technique.
3. Numerical Values of the Kicking Action and Interpretation
Having spatiotemporal (x, y, z, t) data of a movement enables a wide range of biomechanical calculations, provided appropriate models are defined. A key limitation of low-cost motion capture systems is data accuracy, since all derived parameters depend directly on reconstructed coordinate quality.
Temporal parameters:
1. Plant foot contact time: 3433.33 ms
2. Ball contact time: 3833.33 ms
3. Plant-to-impact delay: 400.00 ms
4. Total kick duration: 1216.67 ms
Linear kinematics:
5. Foot velocity at impact: 8.28 m/s
6. Center of mass peak velocity: ~2.96 m/s
Angular kinematics:
7. Maximum knee flexion: 112.4°
8. Knee angle at impact: 31.2°
9. Hip range of motion: 63.7°
10. Ankle angle at impact: 21.8° plantarflexion
Coordination / sequencing:
11. Hip-to-knee peak delay: 16.67 ms
12. Knee-to-impact delay: 33.33 ms
13. Hip-to-impact total delay: 50.00 ms
Spatial structure:
14. Plant foot to ball horizontal distance: 0.544 m
15. Trunk lean angle at impact: 12.4°
16. Estimated ball velocity: 11.1 m/s
The extracted numerical parameters describe the structure of a single kicking action, but their value appears only when translated into performance insight. The following interpretation links these measurements to practical coaching and athlete feedback.
The 400 ms plant-to-impact window suggests adequate time for stabilization before striking. Too short reduces balance; too long reduces explosiveness.
The hip–knee–impact sequence (16–50 ms gaps) reflects a typical whip-like coordination pattern, where momentum is transferred along the kinetic chain from proximal to distal segments.
Foot speed at impact (8.28 m/s), together with strong knee extension, indicates moderate strike intensity with effective segment release, suitable for controlled execution rather than maximal power.
Trunk lean (12.4°) and plant distance (0.54 m) show a generally stable posture, with small adjustments depending on whether the goal is power or accuracy.
Overall, the movement is mechanically consistent, with good coordination and stability. The main improvement focus is enhancing distal speed transfer efficiency rather than altering the overall technique.
4. Kinetic Chain Visualization Through Graphs
The following visual represents (Kinetic Chain Velocity of kicking leg Sequencing During Football Kicking), and Visual 05 is directly connected to the numerical dataset extracted from 3D motion reconstruction we previously introduced. While Visual 06 represents graph values of another student, just as an example for comparison. Each curve represents computed kinematic variables of the hip, knee, foot, and center of mass across the kicking action. The curves highlight the timing and magnitude of peak velocities and the sequencing pattern of the kinetic chain.
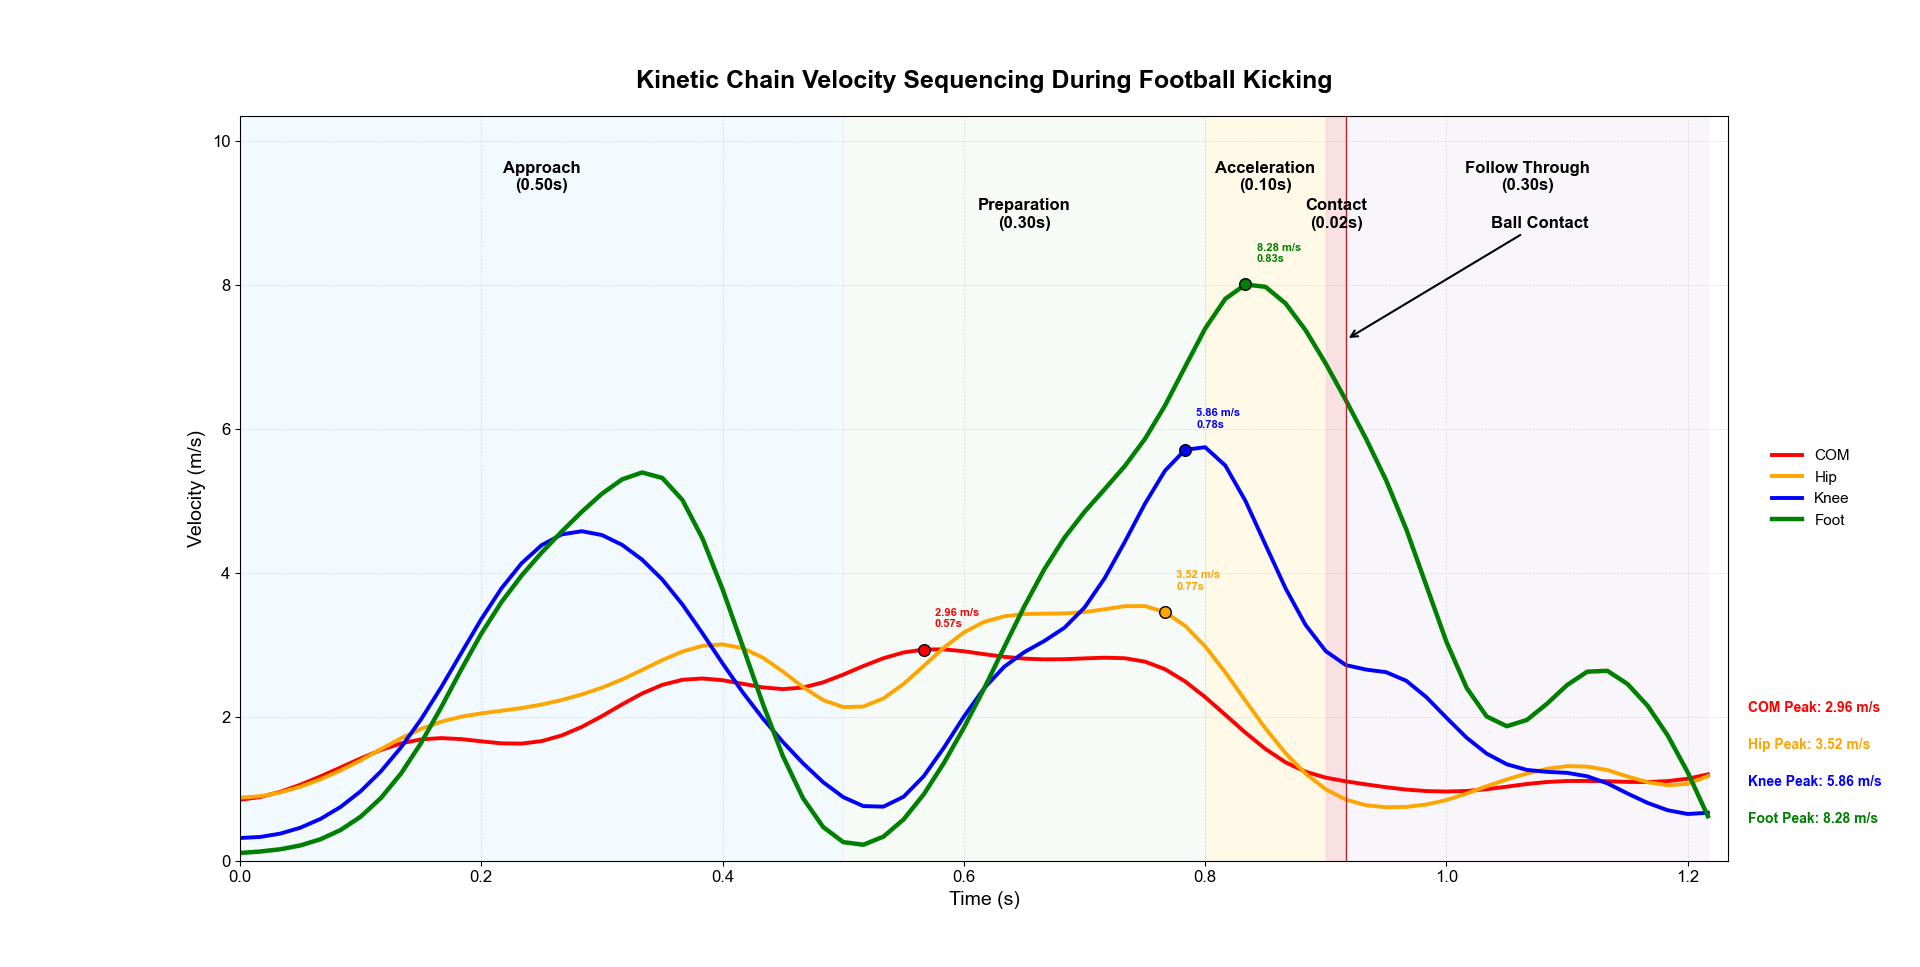
Visual 05
Foot velocity at impact: 8.28 m/s
Knee peak velocity: 5.86 m/s
Hip peak velocity: 3.52 m/s
COM peak velocity: 2.96 m/s
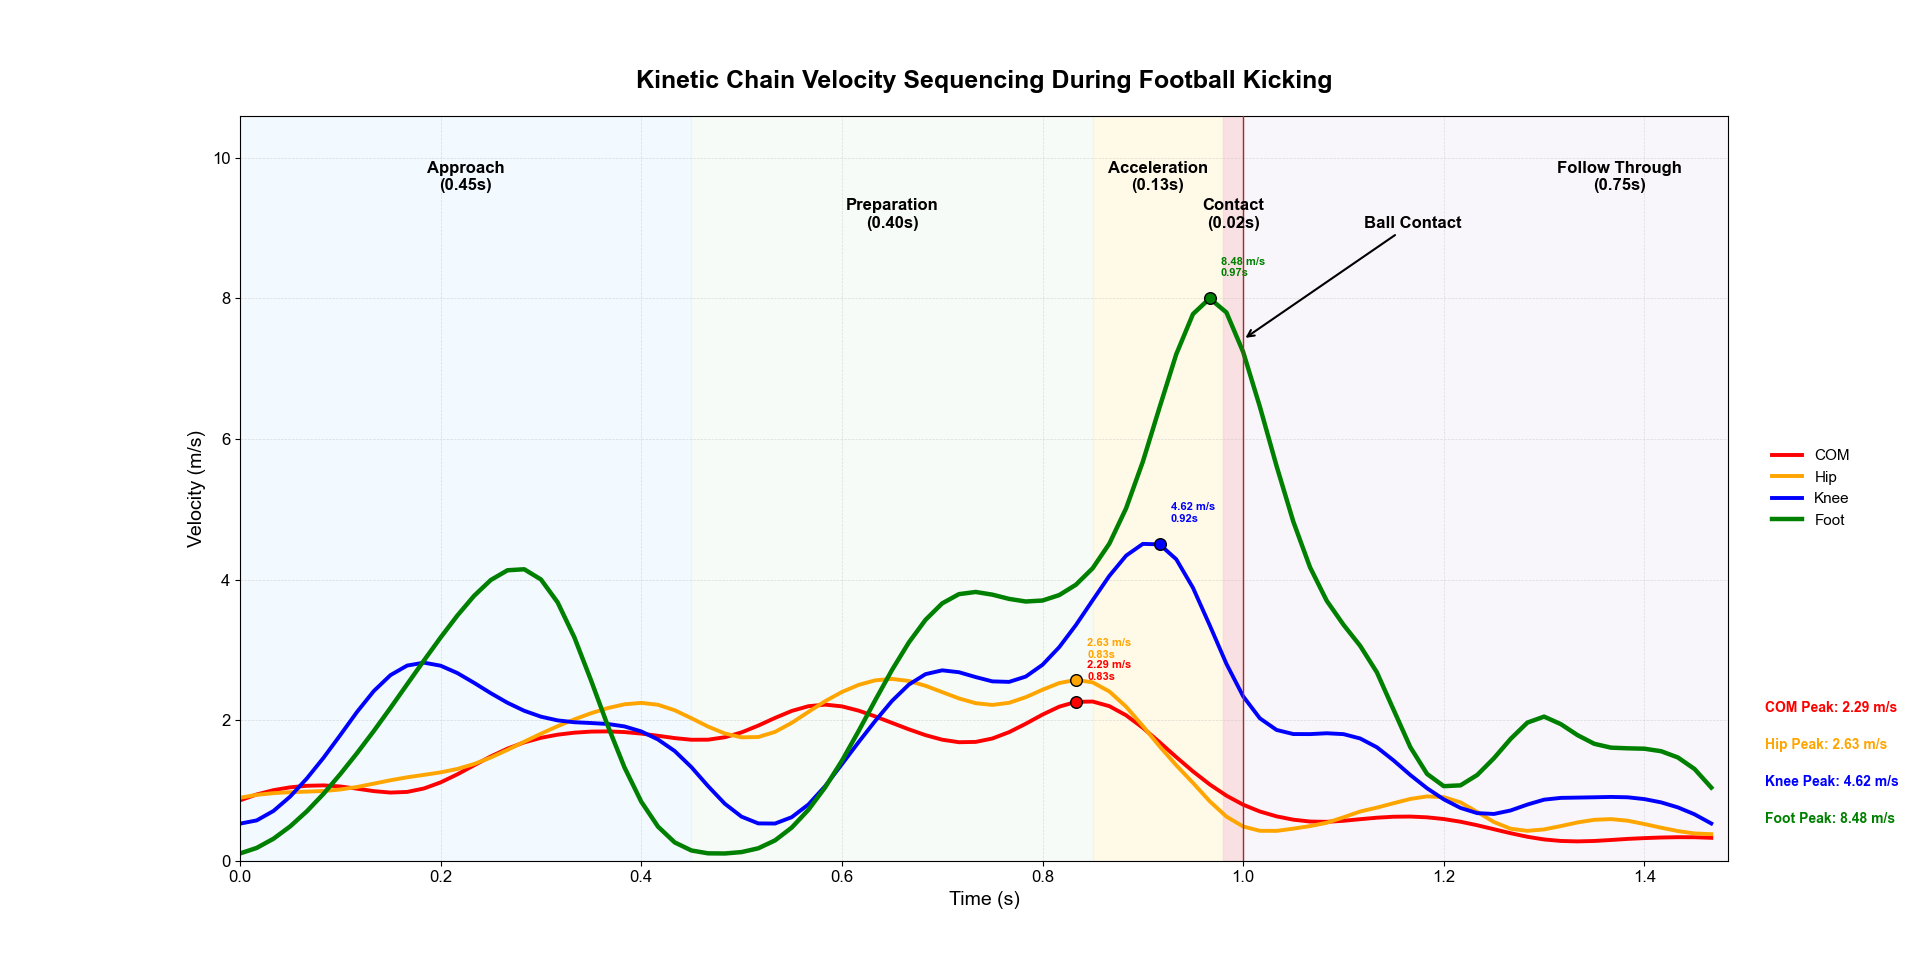
Visual 06
Foot velocity at impact: 8.48 m/s
Knee peak velocity: 4.62 m/s
Hip peak velocity: 2.63 m/s
COM peak velocity: 2.29 m/s
Interpretation and Comparison
The primary difference between the two athletes is not only in peak velocity magnitude but also in the structure of velocity transfer along the kinetic chain.
Visual 05 shows a stronger distal amplification pattern, where velocity increases significantly from proximal (hip) to distal (foot) segments. This indicates more efficient energy transfer through sequential joint activation.
Visual 06 demonstrates a reduced peak velocity at the distal segment and a less pronounced separation between segmental peaks, suggesting weaker proximal-to-distal velocity propagation.
In this case, Visual 05 demonstrates tighter temporal clustering of peak velocities closer to the contact phase, which is typically associated with more effective energy transfer.
Together, the numerical and graphical outputs describe the same system from two perspectives: discrete parameterization and continuous temporal structure.
5. Conclusion
Low-cost motion capture combined with 3D reconstruction demonstrates that meaningful biomechanical analysis can be achieved outside traditional laboratory environments. In this context, expensive biomechanics lab setups may become increasingly impractical for many applied use cases, particularly where accessibility and scalability are required.
The entire workflow presented here was developed independently, without institutional support. As such, it should be interpreted as an individual, exploratory implementation rather than a formally validated research pipeline.
A key limitation is that output quality is strongly dependent on input quality. In this case, 1K 60 fps video recordings directly influence the precision of extracted kinematic values, meaning that all presented results must be interpreted within this constraint.
Finally, the pipeline used in this work has not been formally validated. Despite this, the results suggest that low-cost approaches can still produce structurally meaningful insights into human movement when applied carefully and transparently.
Previous related work:
Link 01: [insert link here]
Link 02: [insert link here]
Link 03: [insert link here]
Link 04: [insert link here]